French vs Iranian Single Father Poverty
COMPARE
French
Iranian
Single Father Poverty
Single Father Poverty Comparison
French
Iranians
18.2%
SINGLE FATHER POVERTY
0.0/ 100
METRIC RATING
297th/ 347
METRIC RANK
14.4%
SINGLE FATHER POVERTY
100.0/ 100
METRIC RATING
25th/ 347
METRIC RANK
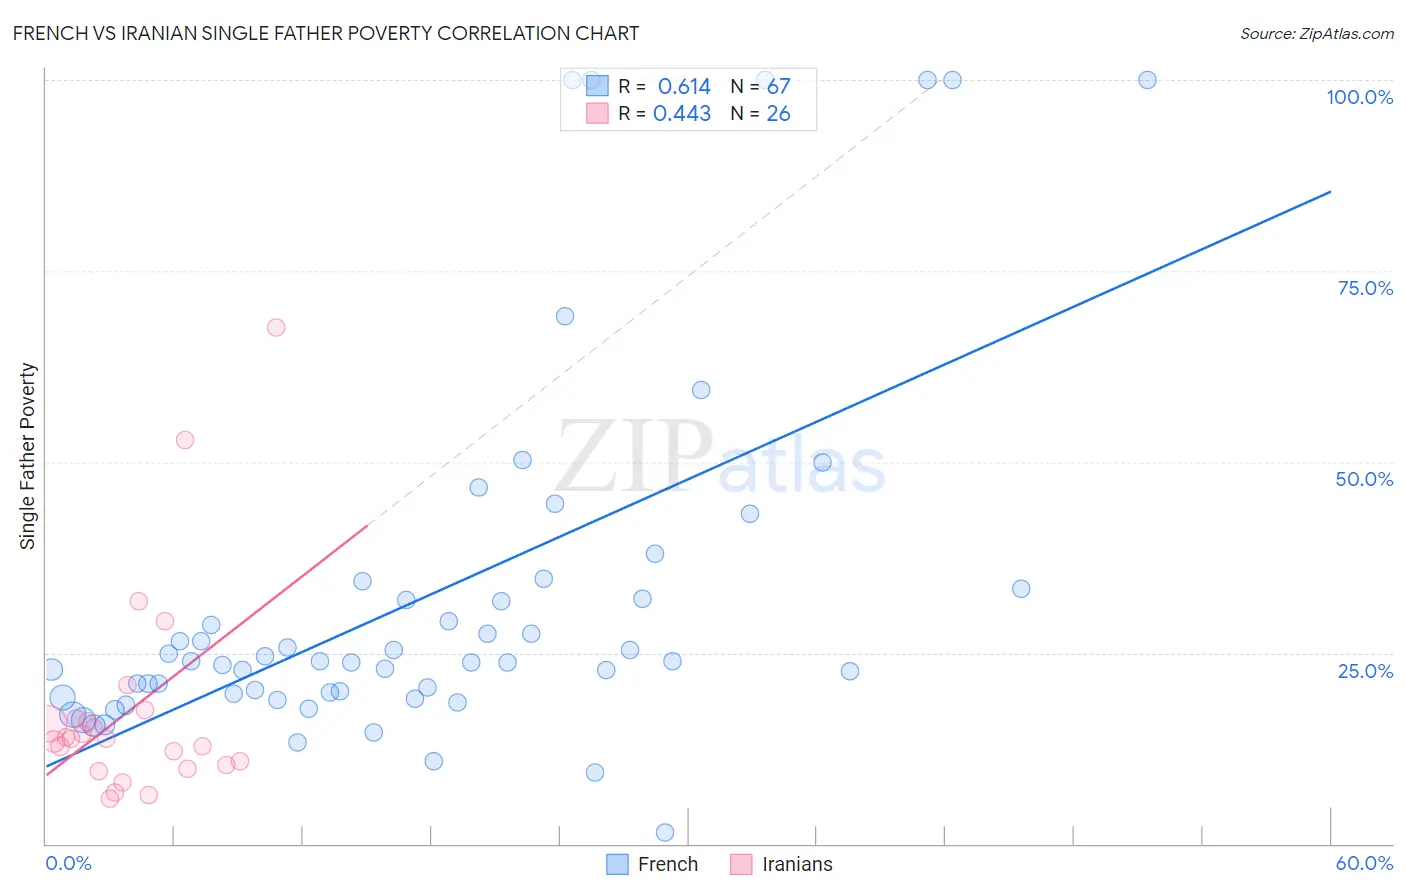
French vs Iranian Single Father Poverty Correlation Chart
The statistical analysis conducted on geographies consisting of 409,472,161 people shows a significant positive correlation between the proportion of French and poverty level among single fathers in the United States with a correlation coefficient (R) of 0.614 and weighted average of 18.2%. Similarly, the statistical analysis conducted on geographies consisting of 254,379,311 people shows a moderate positive correlation between the proportion of Iranians and poverty level among single fathers in the United States with a correlation coefficient (R) of 0.443 and weighted average of 14.4%, a difference of 26.6%.
Single Father Poverty Correlation Summary
| Measurement | French | Iranian |
| Minimum | 1.4% | 6.0% |
| Maximum | 100.0% | 67.6% |
| Range | 98.6% | 61.6% |
| Mean | 32.5% | 17.6% |
| Median | 23.8% | 13.7% |
| Interquartile 25% (IQ1) | 19.7% | 10.3% |
| Interquartile 75% (IQ3) | 33.3% | 16.4% |
| Interquartile Range (IQR) | 13.7% | 6.1% |
| Standard Deviation (Sample) | 24.1% | 14.1% |
| Standard Deviation (Population) | 23.9% | 13.8% |
Similar Demographics by Single Father Poverty
Demographics Similar to French by Single Father Poverty
In terms of single father poverty, the demographic groups most similar to French are Seminole (18.1%, a difference of 0.21%), Yakama (18.1%, a difference of 0.31%), U.S. Virgin Islander (18.1%, a difference of 0.37%), Alaska Native (18.1%, a difference of 0.40%), and Immigrants from Bahamas (18.1%, a difference of 0.51%).
| Demographics | Rating | Rank | Single Father Poverty |
| West Indians | 0.0 /100 | #290 | Tragic 18.0% |
| Alaskan Athabascans | 0.0 /100 | #291 | Tragic 18.1% |
| Immigrants | Bahamas | 0.0 /100 | #292 | Tragic 18.1% |
| Alaska Natives | 0.0 /100 | #293 | Tragic 18.1% |
| U.S. Virgin Islanders | 0.0 /100 | #294 | Tragic 18.1% |
| Yakama | 0.0 /100 | #295 | Tragic 18.1% |
| Seminole | 0.0 /100 | #296 | Tragic 18.1% |
| French | 0.0 /100 | #297 | Tragic 18.2% |
| Africans | 0.0 /100 | #298 | Tragic 18.3% |
| Whites/Caucasians | 0.0 /100 | #299 | Tragic 18.4% |
| Immigrants | Dominican Republic | 0.0 /100 | #300 | Tragic 18.4% |
| Hungarians | 0.0 /100 | #301 | Tragic 18.5% |
| Comanche | 0.0 /100 | #302 | Tragic 18.5% |
| Celtics | 0.0 /100 | #303 | Tragic 18.5% |
| Ute | 0.0 /100 | #304 | Tragic 18.5% |
Demographics Similar to Iranians by Single Father Poverty
In terms of single father poverty, the demographic groups most similar to Iranians are Immigrants from South Eastern Asia (14.4%, a difference of 0.030%), Immigrants from Egypt (14.4%, a difference of 0.040%), Taiwanese (14.3%, a difference of 0.25%), Spanish American Indian (14.4%, a difference of 0.42%), and Nepalese (14.4%, a difference of 0.48%).
| Demographics | Rating | Rank | Single Father Poverty |
| Soviet Union | 100.0 /100 | #18 | Exceptional 14.3% |
| Immigrants | Iraq | 100.0 /100 | #19 | Exceptional 14.3% |
| Immigrants | Singapore | 100.0 /100 | #20 | Exceptional 14.3% |
| Immigrants | Afghanistan | 100.0 /100 | #21 | Exceptional 14.3% |
| Taiwanese | 100.0 /100 | #22 | Exceptional 14.3% |
| Immigrants | Egypt | 100.0 /100 | #23 | Exceptional 14.4% |
| Immigrants | South Eastern Asia | 100.0 /100 | #24 | Exceptional 14.4% |
| Iranians | 100.0 /100 | #25 | Exceptional 14.4% |
| Spanish American Indians | 100.0 /100 | #26 | Exceptional 14.4% |
| Nepalese | 100.0 /100 | #27 | Exceptional 14.4% |
| Immigrants | South Central Asia | 100.0 /100 | #28 | Exceptional 14.5% |
| Somalis | 100.0 /100 | #29 | Exceptional 14.5% |
| Thais | 100.0 /100 | #30 | Exceptional 14.5% |
| Icelanders | 100.0 /100 | #31 | Exceptional 14.5% |
| Asians | 100.0 /100 | #32 | Exceptional 14.6% |