Senegalese vs Immigrants from Latvia Single Father Poverty
COMPARE
Senegalese
Immigrants from Latvia
Single Father Poverty
Single Father Poverty Comparison
Senegalese
Immigrants from Latvia
16.9%
SINGLE FATHER POVERTY
3.2/ 100
METRIC RATING
233rd/ 347
METRIC RANK
15.8%
SINGLE FATHER POVERTY
94.7/ 100
METRIC RATING
112th/ 347
METRIC RANK
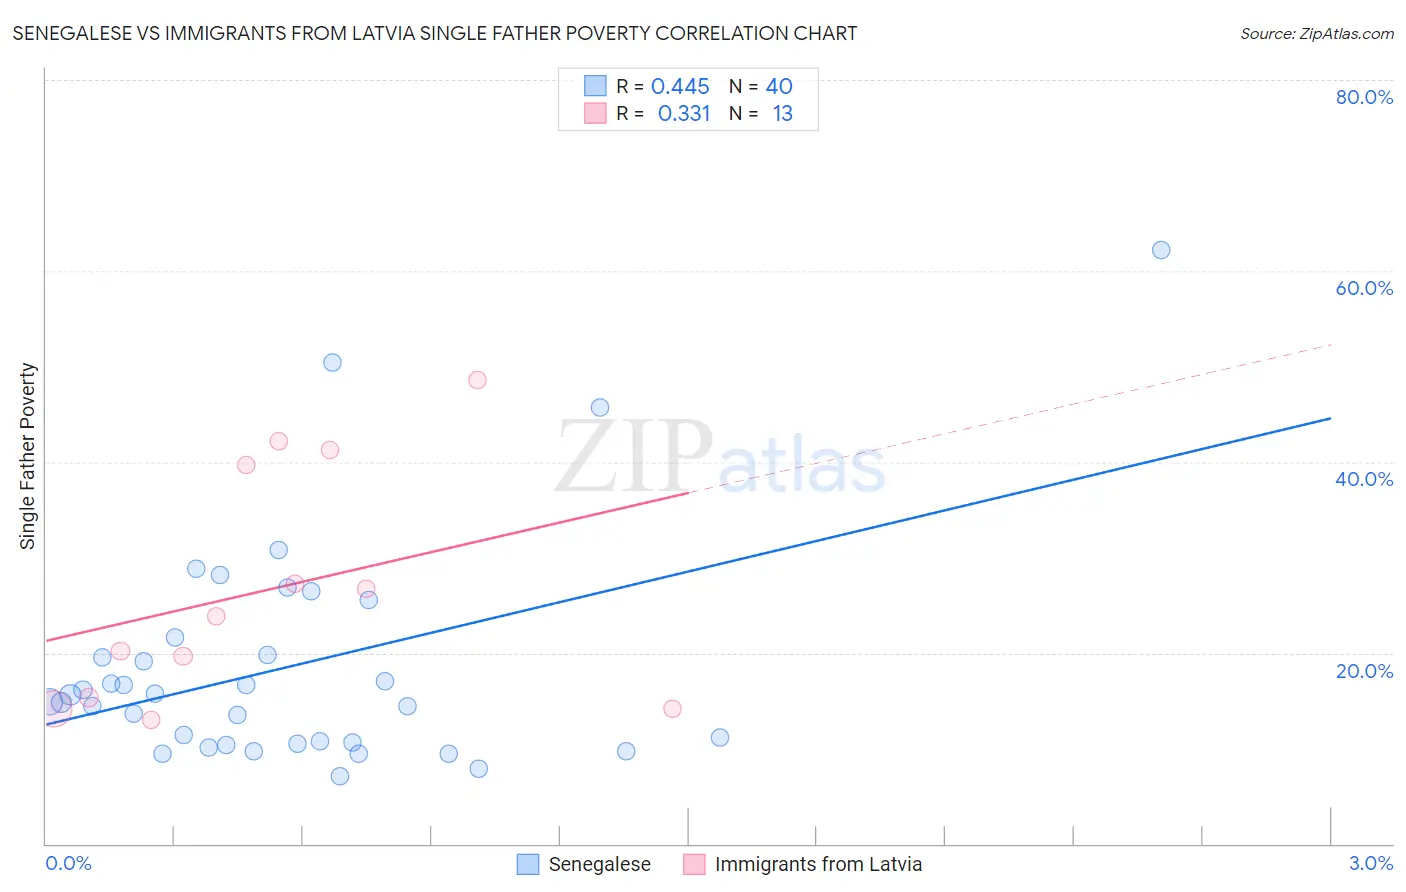
Senegalese vs Immigrants from Latvia Single Father Poverty Correlation Chart
The statistical analysis conducted on geographies consisting of 73,350,667 people shows a moderate positive correlation between the proportion of Senegalese and poverty level among single fathers in the United States with a correlation coefficient (R) of 0.445 and weighted average of 16.9%. Similarly, the statistical analysis conducted on geographies consisting of 98,106,099 people shows a mild positive correlation between the proportion of Immigrants from Latvia and poverty level among single fathers in the United States with a correlation coefficient (R) of 0.331 and weighted average of 15.8%, a difference of 7.2%.
Single Father Poverty Correlation Summary
| Measurement | Senegalese | Immigrants from Latvia |
| Minimum | 7.1% | 12.9% |
| Maximum | 62.2% | 48.6% |
| Range | 55.1% | 35.7% |
| Mean | 18.6% | 26.6% |
| Median | 15.2% | 23.9% |
| Interquartile 25% (IQ1) | 10.5% | 14.7% |
| Interquartile 75% (IQ3) | 20.7% | 40.4% |
| Interquartile Range (IQR) | 10.1% | 25.7% |
| Standard Deviation (Sample) | 11.8% | 12.4% |
| Standard Deviation (Population) | 11.7% | 11.9% |
Similar Demographics by Single Father Poverty
Demographics Similar to Senegalese by Single Father Poverty
In terms of single father poverty, the demographic groups most similar to Senegalese are Marshallese (16.9%, a difference of 0.030%), Immigrants from Western Europe (16.9%, a difference of 0.12%), Immigrants from Germany (16.9%, a difference of 0.12%), Subsaharan African (16.9%, a difference of 0.13%), and Immigrants from Grenada (16.9%, a difference of 0.14%).
| Demographics | Rating | Rank | Single Father Poverty |
| Hispanics or Latinos | 6.1 /100 | #226 | Tragic 16.8% |
| British | 5.6 /100 | #227 | Tragic 16.8% |
| Belgians | 5.3 /100 | #228 | Tragic 16.8% |
| Israelis | 4.6 /100 | #229 | Tragic 16.8% |
| Immigrants | Trinidad and Tobago | 4.5 /100 | #230 | Tragic 16.8% |
| Spanish Americans | 3.7 /100 | #231 | Tragic 16.9% |
| Immigrants | Grenada | 3.7 /100 | #232 | Tragic 16.9% |
| Senegalese | 3.2 /100 | #233 | Tragic 16.9% |
| Marshallese | 3.1 /100 | #234 | Tragic 16.9% |
| Immigrants | Western Europe | 2.9 /100 | #235 | Tragic 16.9% |
| Immigrants | Germany | 2.9 /100 | #236 | Tragic 16.9% |
| Sub-Saharan Africans | 2.9 /100 | #237 | Tragic 16.9% |
| Immigrants | Saudi Arabia | 2.7 /100 | #238 | Tragic 16.9% |
| Bermudans | 2.6 /100 | #239 | Tragic 16.9% |
| Finns | 2.6 /100 | #240 | Tragic 16.9% |
Demographics Similar to Immigrants from Latvia by Single Father Poverty
In terms of single father poverty, the demographic groups most similar to Immigrants from Latvia are Bulgarian (15.8%, a difference of 0.030%), Danish (15.8%, a difference of 0.040%), Argentinean (15.8%, a difference of 0.060%), Immigrants from Africa (15.8%, a difference of 0.080%), and Turkish (15.8%, a difference of 0.090%).
| Demographics | Rating | Rank | Single Father Poverty |
| Immigrants | Australia | 96.1 /100 | #105 | Exceptional 15.7% |
| Immigrants | Poland | 95.8 /100 | #106 | Exceptional 15.7% |
| Native Hawaiians | 95.8 /100 | #107 | Exceptional 15.7% |
| Pakistanis | 95.7 /100 | #108 | Exceptional 15.7% |
| Turks | 95.1 /100 | #109 | Exceptional 15.8% |
| Immigrants | Africa | 95.1 /100 | #110 | Exceptional 15.8% |
| Bulgarians | 94.8 /100 | #111 | Exceptional 15.8% |
| Immigrants | Latvia | 94.7 /100 | #112 | Exceptional 15.8% |
| Danes | 94.5 /100 | #113 | Exceptional 15.8% |
| Argentineans | 94.4 /100 | #114 | Exceptional 15.8% |
| Immigrants | Thailand | 93.6 /100 | #115 | Exceptional 15.8% |
| Immigrants | Argentina | 92.8 /100 | #116 | Exceptional 15.8% |
| Immigrants | Colombia | 92.6 /100 | #117 | Exceptional 15.8% |
| Immigrants | Eastern Europe | 92.5 /100 | #118 | Exceptional 15.8% |
| Immigrants | Belarus | 92.4 /100 | #119 | Exceptional 15.8% |