Cajun vs Immigrants from Latvia Single Father Poverty
COMPARE
Cajun
Immigrants from Latvia
Single Father Poverty
Single Father Poverty Comparison
Cajuns
Immigrants from Latvia
23.1%
SINGLE FATHER POVERTY
0.0/ 100
METRIC RATING
336th/ 347
METRIC RANK
15.8%
SINGLE FATHER POVERTY
94.7/ 100
METRIC RATING
112th/ 347
METRIC RANK
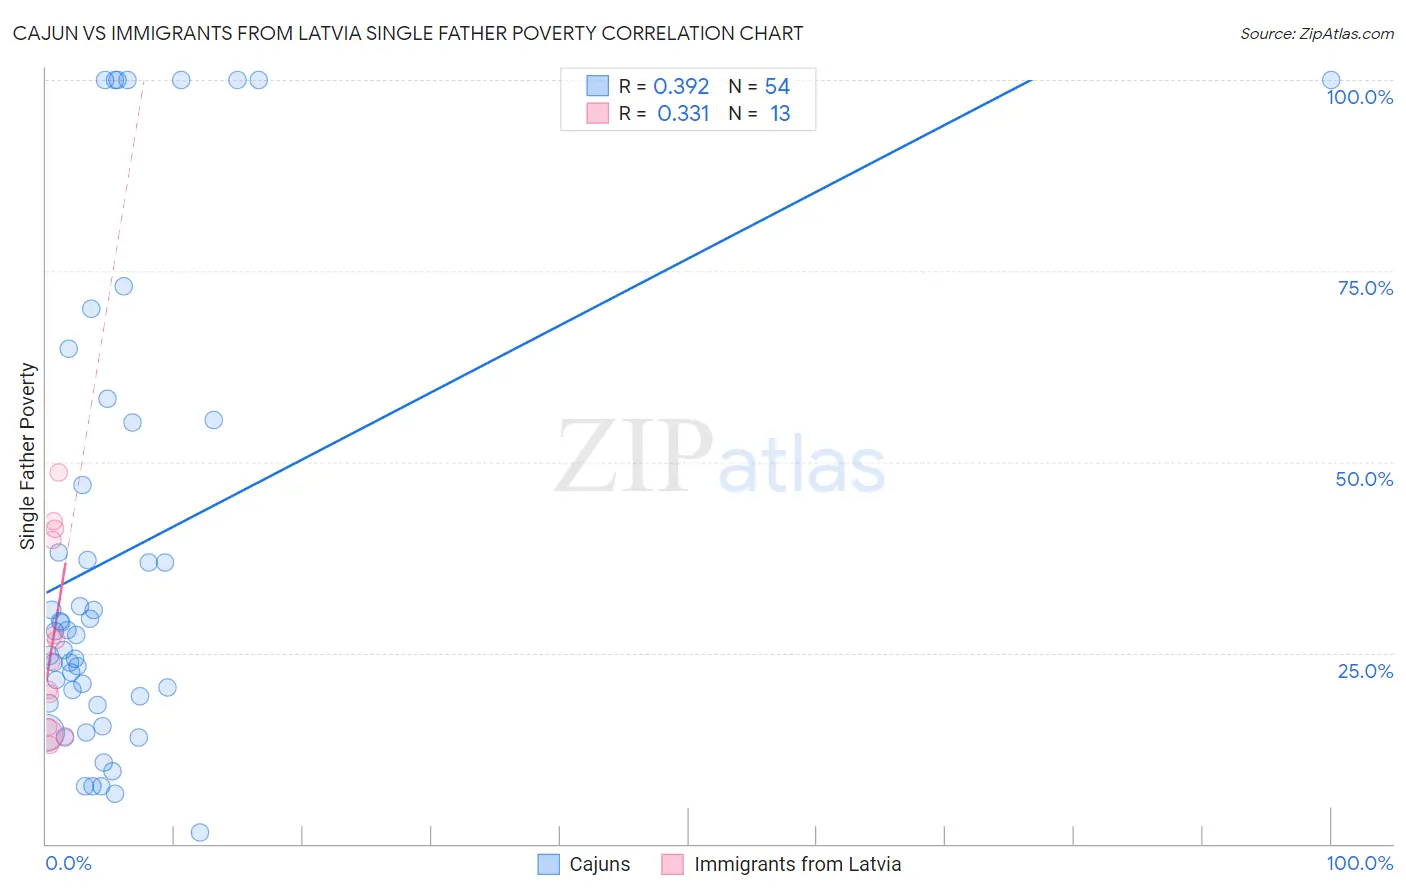
Cajun vs Immigrants from Latvia Single Father Poverty Correlation Chart
The statistical analysis conducted on geographies consisting of 130,032,102 people shows a mild positive correlation between the proportion of Cajuns and poverty level among single fathers in the United States with a correlation coefficient (R) of 0.392 and weighted average of 23.1%. Similarly, the statistical analysis conducted on geographies consisting of 98,106,099 people shows a mild positive correlation between the proportion of Immigrants from Latvia and poverty level among single fathers in the United States with a correlation coefficient (R) of 0.331 and weighted average of 15.8%, a difference of 46.3%.
Single Father Poverty Correlation Summary
| Measurement | Cajun | Immigrants from Latvia |
| Minimum | 1.4% | 12.9% |
| Maximum | 100.0% | 48.6% |
| Range | 98.6% | 35.7% |
| Mean | 38.2% | 26.6% |
| Median | 27.6% | 23.9% |
| Interquartile 25% (IQ1) | 18.4% | 14.7% |
| Interquartile 75% (IQ3) | 55.1% | 40.4% |
| Interquartile Range (IQR) | 36.7% | 25.7% |
| Standard Deviation (Sample) | 30.3% | 12.4% |
| Standard Deviation (Population) | 30.0% | 11.9% |
Similar Demographics by Single Father Poverty
Demographics Similar to Cajuns by Single Father Poverty
In terms of single father poverty, the demographic groups most similar to Cajuns are Shoshone (22.9%, a difference of 0.71%), Kiowa (22.5%, a difference of 2.7%), Native/Alaskan (22.4%, a difference of 3.0%), Sioux (23.9%, a difference of 3.5%), and Arapaho (24.0%, a difference of 3.9%).
| Demographics | Rating | Rank | Single Father Poverty |
| Colville | 0.0 /100 | #329 | Tragic 21.4% |
| Paiute | 0.0 /100 | #330 | Tragic 21.6% |
| Central American Indians | 0.0 /100 | #331 | Tragic 21.7% |
| Tohono O'odham | 0.0 /100 | #332 | Tragic 22.0% |
| Natives/Alaskans | 0.0 /100 | #333 | Tragic 22.4% |
| Kiowa | 0.0 /100 | #334 | Tragic 22.5% |
| Shoshone | 0.0 /100 | #335 | Tragic 22.9% |
| Cajuns | 0.0 /100 | #336 | Tragic 23.1% |
| Sioux | 0.0 /100 | #337 | Tragic 23.9% |
| Arapaho | 0.0 /100 | #338 | Tragic 24.0% |
| Apache | 0.0 /100 | #339 | Tragic 24.2% |
| Houma | 0.0 /100 | #340 | Tragic 26.7% |
| Hopi | 0.0 /100 | #341 | Tragic 27.2% |
| Yuman | 0.0 /100 | #342 | Tragic 28.4% |
| Lumbee | 0.0 /100 | #343 | Tragic 28.5% |
Demographics Similar to Immigrants from Latvia by Single Father Poverty
In terms of single father poverty, the demographic groups most similar to Immigrants from Latvia are Bulgarian (15.8%, a difference of 0.030%), Danish (15.8%, a difference of 0.040%), Argentinean (15.8%, a difference of 0.060%), Immigrants from Africa (15.8%, a difference of 0.080%), and Turkish (15.8%, a difference of 0.090%).
| Demographics | Rating | Rank | Single Father Poverty |
| Immigrants | Australia | 96.1 /100 | #105 | Exceptional 15.7% |
| Immigrants | Poland | 95.8 /100 | #106 | Exceptional 15.7% |
| Native Hawaiians | 95.8 /100 | #107 | Exceptional 15.7% |
| Pakistanis | 95.7 /100 | #108 | Exceptional 15.7% |
| Turks | 95.1 /100 | #109 | Exceptional 15.8% |
| Immigrants | Africa | 95.1 /100 | #110 | Exceptional 15.8% |
| Bulgarians | 94.8 /100 | #111 | Exceptional 15.8% |
| Immigrants | Latvia | 94.7 /100 | #112 | Exceptional 15.8% |
| Danes | 94.5 /100 | #113 | Exceptional 15.8% |
| Argentineans | 94.4 /100 | #114 | Exceptional 15.8% |
| Immigrants | Thailand | 93.6 /100 | #115 | Exceptional 15.8% |
| Immigrants | Argentina | 92.8 /100 | #116 | Exceptional 15.8% |
| Immigrants | Colombia | 92.6 /100 | #117 | Exceptional 15.8% |
| Immigrants | Eastern Europe | 92.5 /100 | #118 | Exceptional 15.8% |
| Immigrants | Belarus | 92.4 /100 | #119 | Exceptional 15.8% |