Fijian vs Slavic Poverty
COMPARE
Fijian
Slavic
Poverty
Poverty Comparison
Fijians
Slavs
13.7%
POVERTY
0.8/ 100
METRIC RATING
232nd/ 347
METRIC RANK
11.5%
POVERTY
93.3/ 100
METRIC RATING
101st/ 347
METRIC RANK
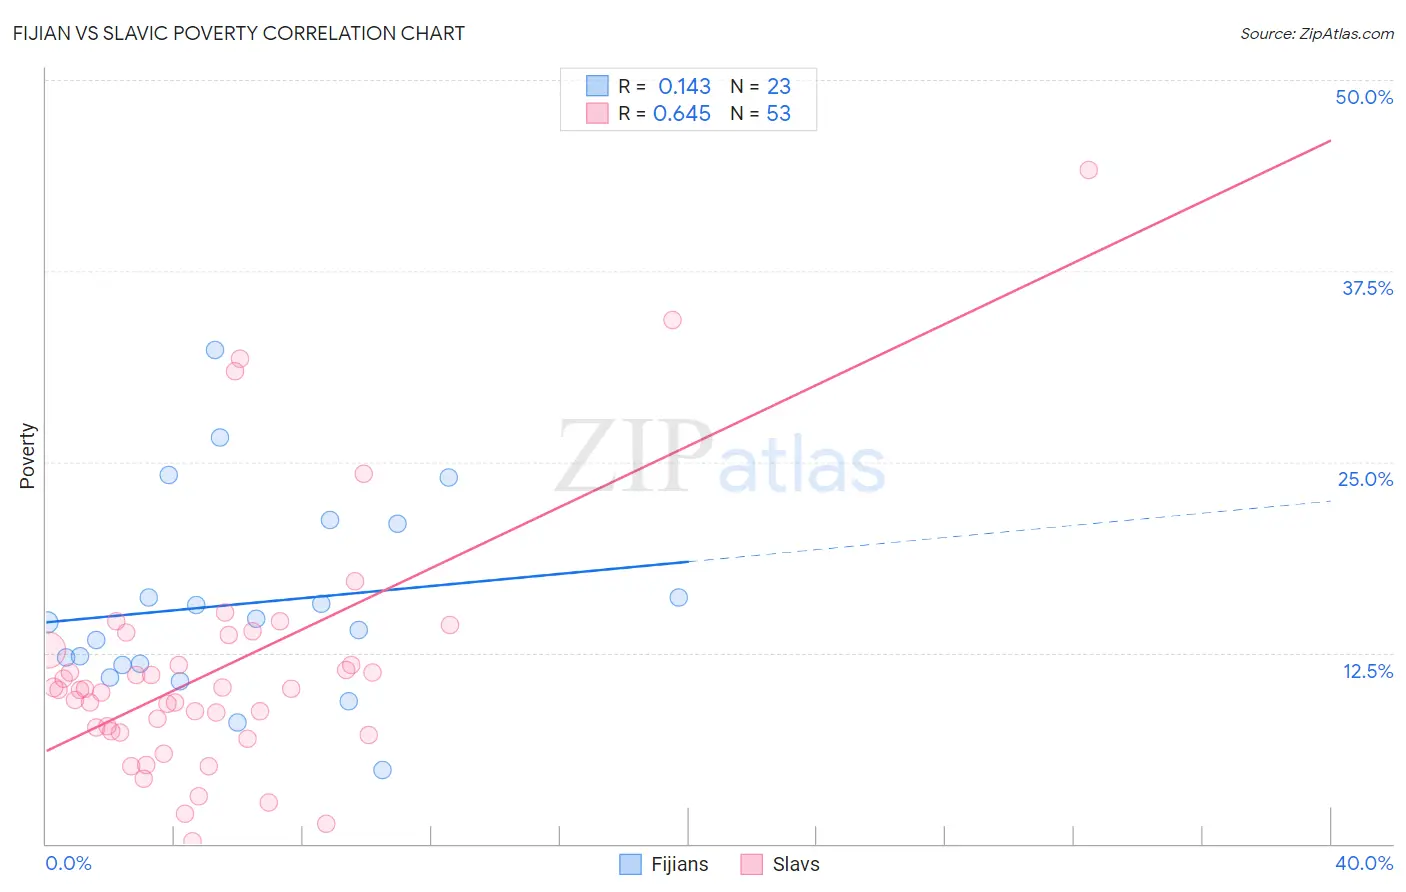
Fijian vs Slavic Poverty Correlation Chart
The statistical analysis conducted on geographies consisting of 55,947,896 people shows a poor positive correlation between the proportion of Fijians and poverty level in the United States with a correlation coefficient (R) of 0.143 and weighted average of 13.7%. Similarly, the statistical analysis conducted on geographies consisting of 270,786,783 people shows a significant positive correlation between the proportion of Slavs and poverty level in the United States with a correlation coefficient (R) of 0.645 and weighted average of 11.5%, a difference of 19.1%.
Poverty Correlation Summary
| Measurement | Fijian | Slavic |
| Minimum | 4.9% | 0.14% |
| Maximum | 32.3% | 44.1% |
| Range | 27.5% | 43.9% |
| Mean | 15.7% | 11.4% |
| Median | 14.5% | 10.1% |
| Interquartile 25% (IQ1) | 11.7% | 7.4% |
| Interquartile 75% (IQ3) | 21.0% | 13.2% |
| Interquartile Range (IQR) | 9.3% | 5.8% |
| Standard Deviation (Sample) | 6.5% | 8.2% |
| Standard Deviation (Population) | 6.3% | 8.1% |
Similar Demographics by Poverty
Demographics Similar to Fijians by Poverty
In terms of poverty, the demographic groups most similar to Fijians are Immigrants from Saudi Arabia (13.8%, a difference of 0.25%), Immigrants from Laos (13.8%, a difference of 0.49%), Cuban (13.9%, a difference of 0.93%), Immigrants from Armenia (13.9%, a difference of 0.96%), and French American Indian (13.9%, a difference of 0.98%).
| Demographics | Rating | Rank | Poverty |
| German Russians | 2.2 /100 | #225 | Tragic 13.4% |
| Marshallese | 2.2 /100 | #226 | Tragic 13.4% |
| Alaska Natives | 2.1 /100 | #227 | Tragic 13.5% |
| Immigrants | Nigeria | 1.7 /100 | #228 | Tragic 13.5% |
| Osage | 1.5 /100 | #229 | Tragic 13.6% |
| Alaskan Athabascans | 1.5 /100 | #230 | Tragic 13.6% |
| Nigerians | 1.4 /100 | #231 | Tragic 13.6% |
| Fijians | 0.8 /100 | #232 | Tragic 13.7% |
| Immigrants | Saudi Arabia | 0.8 /100 | #233 | Tragic 13.8% |
| Immigrants | Laos | 0.7 /100 | #234 | Tragic 13.8% |
| Cubans | 0.6 /100 | #235 | Tragic 13.9% |
| Immigrants | Armenia | 0.5 /100 | #236 | Tragic 13.9% |
| French American Indians | 0.5 /100 | #237 | Tragic 13.9% |
| Ghanaians | 0.5 /100 | #238 | Tragic 13.9% |
| Nicaraguans | 0.4 /100 | #239 | Tragic 13.9% |
Demographics Similar to Slavs by Poverty
In terms of poverty, the demographic groups most similar to Slavs are Scottish (11.5%, a difference of 0.31%), Laotian (11.6%, a difference of 0.34%), Okinawan (11.6%, a difference of 0.34%), Immigrants from Indonesia (11.5%, a difference of 0.42%), and Native Hawaiian (11.6%, a difference of 0.45%).
| Demographics | Rating | Rank | Poverty |
| Paraguayans | 94.9 /100 | #94 | Exceptional 11.4% |
| Australians | 94.9 /100 | #95 | Exceptional 11.4% |
| Immigrants | South Africa | 94.7 /100 | #96 | Exceptional 11.5% |
| Immigrants | Egypt | 94.6 /100 | #97 | Exceptional 11.5% |
| Immigrants | Latvia | 94.5 /100 | #98 | Exceptional 11.5% |
| Immigrants | Indonesia | 94.2 /100 | #99 | Exceptional 11.5% |
| Scottish | 94.0 /100 | #100 | Exceptional 11.5% |
| Slavs | 93.3 /100 | #101 | Exceptional 11.5% |
| Laotians | 92.4 /100 | #102 | Exceptional 11.6% |
| Okinawans | 92.4 /100 | #103 | Exceptional 11.6% |
| Native Hawaiians | 92.1 /100 | #104 | Exceptional 11.6% |
| Portuguese | 92.1 /100 | #105 | Exceptional 11.6% |
| Immigrants | Zimbabwe | 92.1 /100 | #106 | Exceptional 11.6% |
| Palestinians | 91.8 /100 | #107 | Exceptional 11.6% |
| Canadians | 91.7 /100 | #108 | Exceptional 11.6% |