Fijian vs Immigrants from Cambodia Poverty
COMPARE
Fijian
Immigrants from Cambodia
Poverty
Poverty Comparison
Fijians
Immigrants from Cambodia
13.7%
POVERTY
0.8/ 100
METRIC RATING
232nd/ 347
METRIC RANK
13.4%
POVERTY
3.0/ 100
METRIC RATING
219th/ 347
METRIC RANK
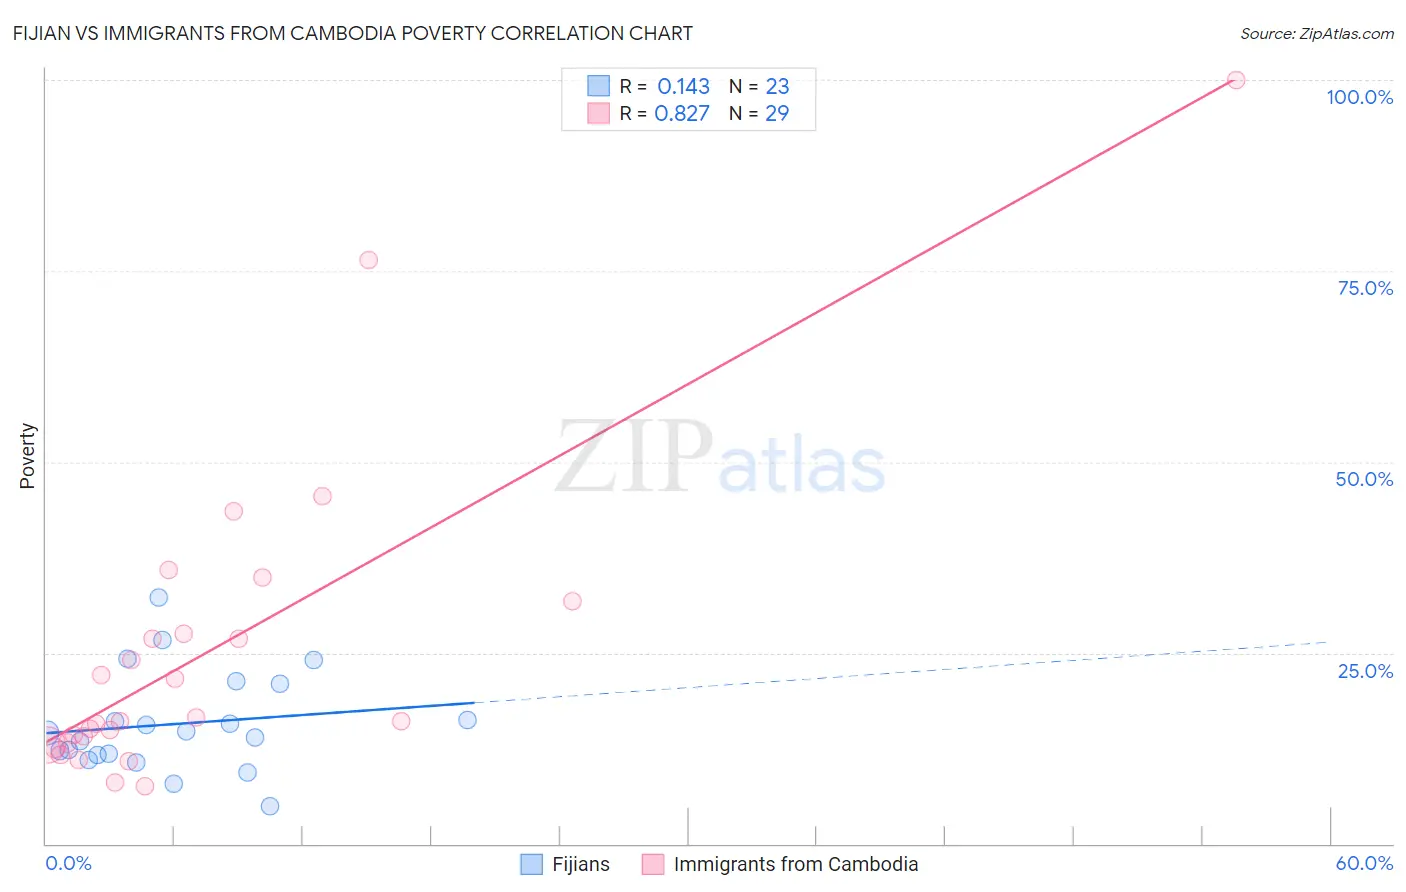
Fijian vs Immigrants from Cambodia Poverty Correlation Chart
The statistical analysis conducted on geographies consisting of 55,947,896 people shows a poor positive correlation between the proportion of Fijians and poverty level in the United States with a correlation coefficient (R) of 0.143 and weighted average of 13.7%. Similarly, the statistical analysis conducted on geographies consisting of 205,130,187 people shows a very strong positive correlation between the proportion of Immigrants from Cambodia and poverty level in the United States with a correlation coefficient (R) of 0.827 and weighted average of 13.4%, a difference of 2.9%.
Poverty Correlation Summary
| Measurement | Fijian | Immigrants from Cambodia |
| Minimum | 4.9% | 7.5% |
| Maximum | 32.3% | 100.0% |
| Range | 27.5% | 92.5% |
| Mean | 15.7% | 25.1% |
| Median | 14.5% | 16.0% |
| Interquartile 25% (IQ1) | 11.7% | 13.1% |
| Interquartile 75% (IQ3) | 21.0% | 29.7% |
| Interquartile Range (IQR) | 9.3% | 16.6% |
| Standard Deviation (Sample) | 6.5% | 20.4% |
| Standard Deviation (Population) | 6.3% | 20.1% |
Demographics Similar to Fijians and Immigrants from Cambodia by Poverty
In terms of poverty, the demographic groups most similar to Fijians are Immigrants from Saudi Arabia (13.8%, a difference of 0.25%), Immigrants from Laos (13.8%, a difference of 0.49%), Cuban (13.9%, a difference of 0.93%), Nigerian (13.6%, a difference of 1.1%), and Alaskan Athabascan (13.6%, a difference of 1.2%). Similarly, the demographic groups most similar to Immigrants from Cambodia are American (13.4%, a difference of 0.090%), Immigrants from Thailand (13.3%, a difference of 0.12%), Immigrants from Uzbekistan (13.3%, a difference of 0.19%), Japanese (13.3%, a difference of 0.23%), and Nonimmigrants (13.3%, a difference of 0.23%).
| Demographics | Rating | Rank | Poverty |
| Japanese | 3.3 /100 | #215 | Tragic 13.3% |
| Immigrants | Nonimmigrants | 3.3 /100 | #216 | Tragic 13.3% |
| Immigrants | Uzbekistan | 3.2 /100 | #217 | Tragic 13.3% |
| Immigrants | Thailand | 3.1 /100 | #218 | Tragic 13.3% |
| Immigrants | Cambodia | 3.0 /100 | #219 | Tragic 13.4% |
| Americans | 2.9 /100 | #220 | Tragic 13.4% |
| Alsatians | 2.6 /100 | #221 | Tragic 13.4% |
| Immigrants | Micronesia | 2.6 /100 | #222 | Tragic 13.4% |
| Immigrants | Africa | 2.5 /100 | #223 | Tragic 13.4% |
| Immigrants | Eritrea | 2.4 /100 | #224 | Tragic 13.4% |
| German Russians | 2.2 /100 | #225 | Tragic 13.4% |
| Marshallese | 2.2 /100 | #226 | Tragic 13.4% |
| Alaska Natives | 2.1 /100 | #227 | Tragic 13.5% |
| Immigrants | Nigeria | 1.7 /100 | #228 | Tragic 13.5% |
| Osage | 1.5 /100 | #229 | Tragic 13.6% |
| Alaskan Athabascans | 1.5 /100 | #230 | Tragic 13.6% |
| Nigerians | 1.4 /100 | #231 | Tragic 13.6% |
| Fijians | 0.8 /100 | #232 | Tragic 13.7% |
| Immigrants | Saudi Arabia | 0.8 /100 | #233 | Tragic 13.8% |
| Immigrants | Laos | 0.7 /100 | #234 | Tragic 13.8% |
| Cubans | 0.6 /100 | #235 | Tragic 13.9% |