Fijian vs Slavic Single Mother Households
COMPARE
Fijian
Slavic
Single Mother Households
Single Mother Households Comparison
Fijians
Slavs
7.2%
SINGLE MOTHER HOUSEHOLDS
0.6/ 100
METRIC RATING
242nd/ 347
METRIC RANK
5.9%
SINGLE MOTHER HOUSEHOLDS
92.9/ 100
METRIC RATING
125th/ 347
METRIC RANK
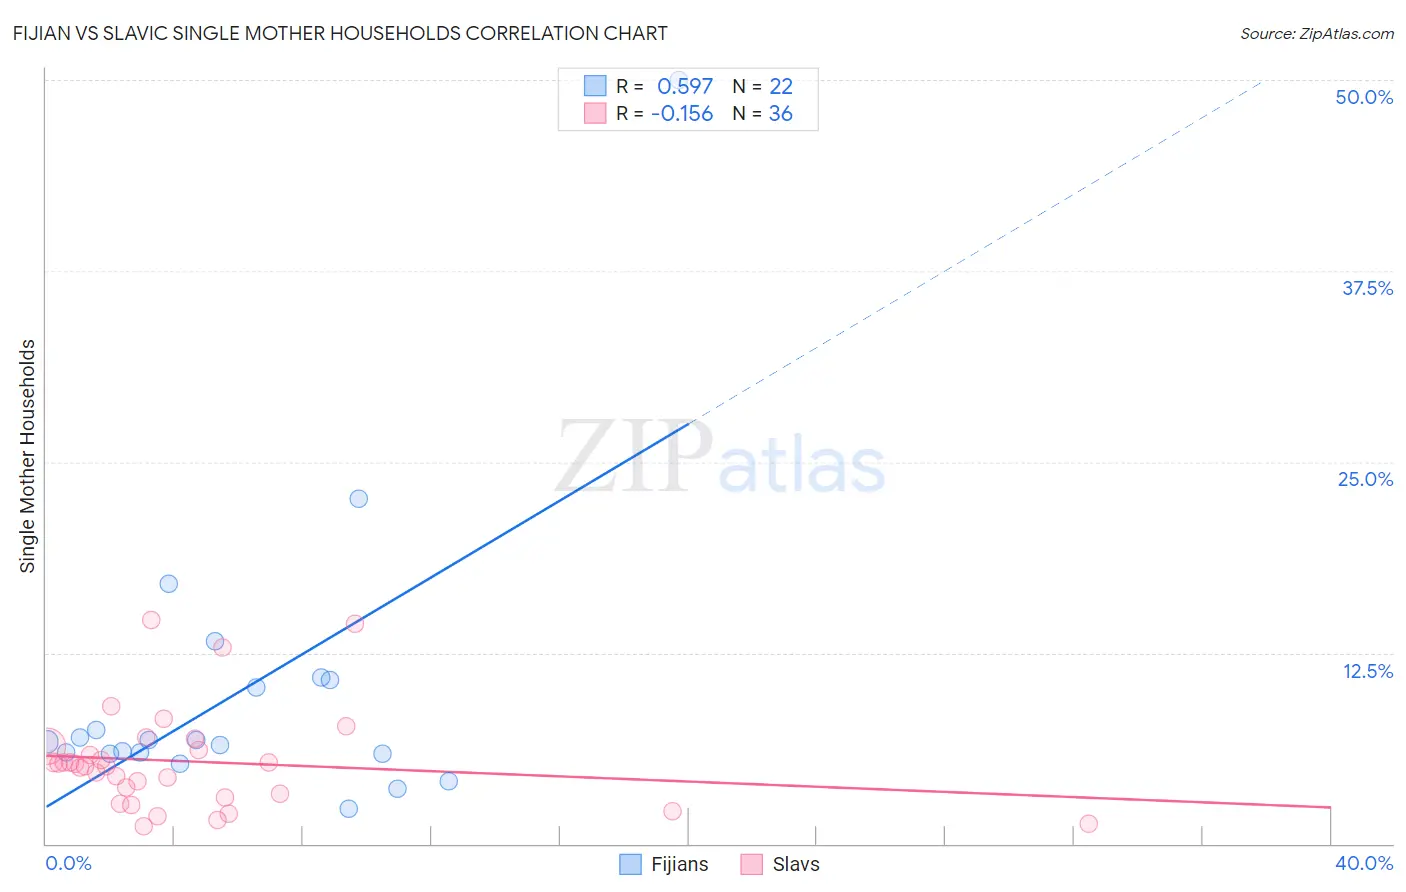
Fijian vs Slavic Single Mother Households Correlation Chart
The statistical analysis conducted on geographies consisting of 55,926,537 people shows a substantial positive correlation between the proportion of Fijians and percentage of single mother households in the United States with a correlation coefficient (R) of 0.597 and weighted average of 7.2%. Similarly, the statistical analysis conducted on geographies consisting of 270,240,357 people shows a poor negative correlation between the proportion of Slavs and percentage of single mother households in the United States with a correlation coefficient (R) of -0.156 and weighted average of 5.9%, a difference of 22.6%.
Single Mother Households Correlation Summary
| Measurement | Fijian | Slavic |
| Minimum | 2.3% | 1.2% |
| Maximum | 50.0% | 14.6% |
| Range | 47.7% | 13.5% |
| Mean | 10.0% | 5.4% |
| Median | 6.7% | 5.2% |
| Interquartile 25% (IQ1) | 5.9% | 3.1% |
| Interquartile 75% (IQ3) | 10.7% | 6.3% |
| Interquartile Range (IQR) | 4.8% | 3.1% |
| Standard Deviation (Sample) | 10.0% | 3.3% |
| Standard Deviation (Population) | 9.8% | 3.2% |
Similar Demographics by Single Mother Households
Demographics Similar to Fijians by Single Mother Households
In terms of single mother households, the demographic groups most similar to Fijians are Ecuadorian (7.2%, a difference of 0.050%), Immigrants from Portugal (7.2%, a difference of 0.080%), Cuban (7.2%, a difference of 0.11%), Immigrants from Panama (7.2%, a difference of 0.43%), and Immigrants from Cambodia (7.2%, a difference of 0.46%).
| Demographics | Rating | Rank | Single Mother Households |
| Immigrants | Burma/Myanmar | 1.4 /100 | #235 | Tragic 7.0% |
| Ute | 1.0 /100 | #236 | Tragic 7.1% |
| Arapaho | 1.0 /100 | #237 | Tragic 7.1% |
| Panamanians | 0.9 /100 | #238 | Tragic 7.1% |
| Kiowa | 0.8 /100 | #239 | Tragic 7.1% |
| Immigrants | Panama | 0.7 /100 | #240 | Tragic 7.2% |
| Immigrants | Portugal | 0.6 /100 | #241 | Tragic 7.2% |
| Fijians | 0.6 /100 | #242 | Tragic 7.2% |
| Ecuadorians | 0.6 /100 | #243 | Tragic 7.2% |
| Cubans | 0.6 /100 | #244 | Tragic 7.2% |
| Immigrants | Cambodia | 0.5 /100 | #245 | Tragic 7.2% |
| Nicaraguans | 0.5 /100 | #246 | Tragic 7.2% |
| Dutch West Indians | 0.4 /100 | #247 | Tragic 7.3% |
| Spanish American Indians | 0.4 /100 | #248 | Tragic 7.3% |
| Bermudans | 0.4 /100 | #249 | Tragic 7.3% |
Demographics Similar to Slavs by Single Mother Households
In terms of single mother households, the demographic groups most similar to Slavs are Welsh (5.9%, a difference of 0.020%), Immigrants from Argentina (5.9%, a difference of 0.16%), Lebanese (5.9%, a difference of 0.21%), Immigrants from Uzbekistan (5.9%, a difference of 0.23%), and Belgian (5.8%, a difference of 0.29%).
| Demographics | Rating | Rank | Single Mother Households |
| Laotians | 94.3 /100 | #118 | Exceptional 5.8% |
| South Africans | 94.1 /100 | #119 | Exceptional 5.8% |
| Tongans | 93.7 /100 | #120 | Exceptional 5.8% |
| Argentineans | 93.7 /100 | #121 | Exceptional 5.8% |
| Belgians | 93.5 /100 | #122 | Exceptional 5.8% |
| Immigrants | Uzbekistan | 93.4 /100 | #123 | Exceptional 5.9% |
| Immigrants | Argentina | 93.2 /100 | #124 | Exceptional 5.9% |
| Slavs | 92.9 /100 | #125 | Exceptional 5.9% |
| Welsh | 92.8 /100 | #126 | Exceptional 5.9% |
| Lebanese | 92.4 /100 | #127 | Exceptional 5.9% |
| Czechoslovakians | 92.2 /100 | #128 | Exceptional 5.9% |
| Immigrants | Bolivia | 92.2 /100 | #129 | Exceptional 5.9% |
| Palestinians | 92.1 /100 | #130 | Exceptional 5.9% |
| Immigrants | Spain | 91.2 /100 | #131 | Exceptional 5.9% |
| Albanians | 91.1 /100 | #132 | Exceptional 5.9% |