Immigrants from Chile vs Slavic Poverty
COMPARE
Immigrants from Chile
Slavic
Poverty
Poverty Comparison
Immigrants from Chile
Slavs
12.2%
POVERTY
56.7/ 100
METRIC RATING
167th/ 347
METRIC RANK
11.5%
POVERTY
93.3/ 100
METRIC RATING
101st/ 347
METRIC RANK
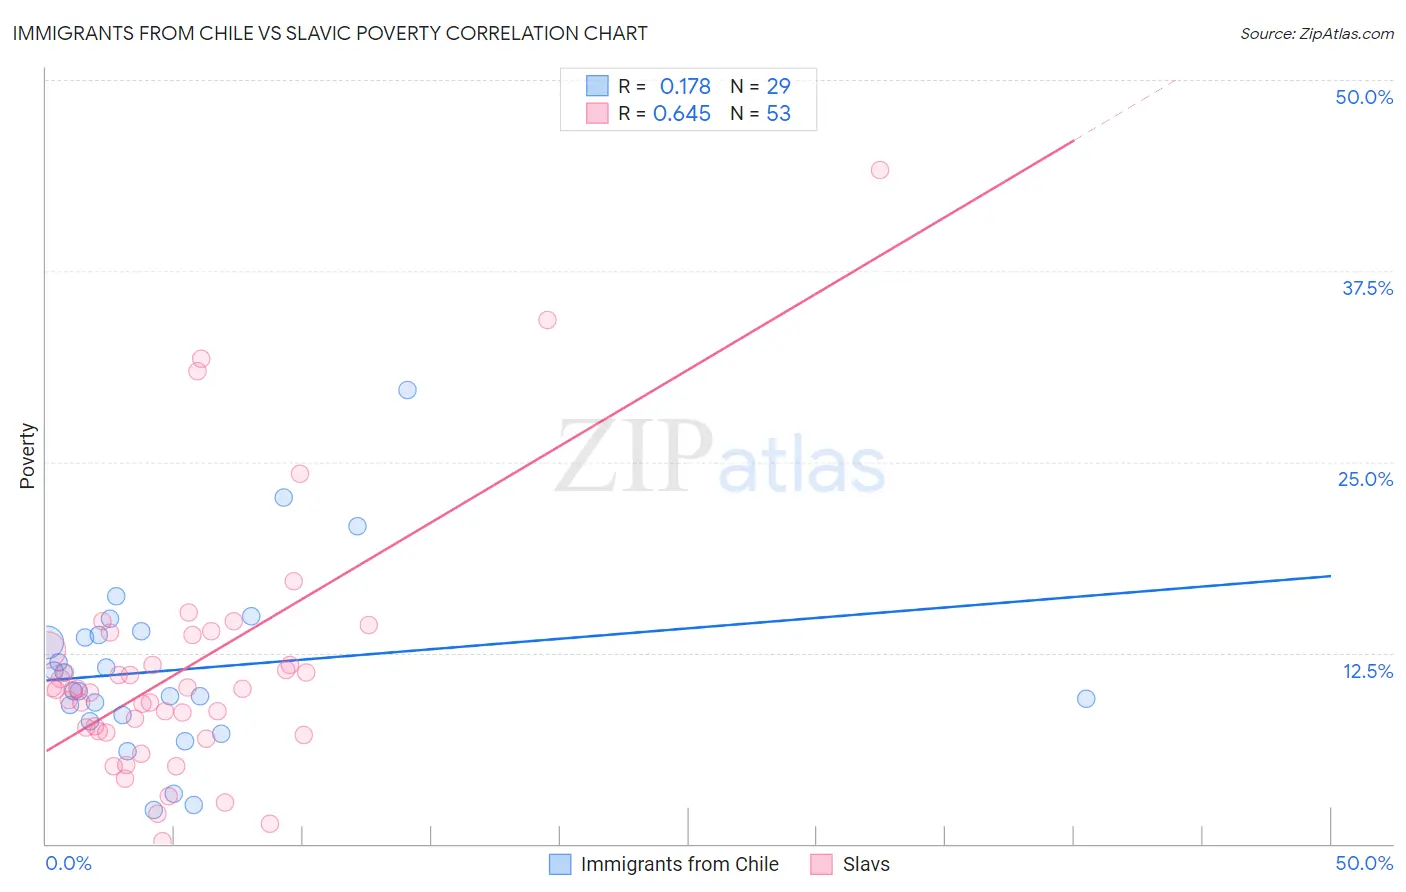
Immigrants from Chile vs Slavic Poverty Correlation Chart
The statistical analysis conducted on geographies consisting of 218,605,054 people shows a poor positive correlation between the proportion of Immigrants from Chile and poverty level in the United States with a correlation coefficient (R) of 0.178 and weighted average of 12.2%. Similarly, the statistical analysis conducted on geographies consisting of 270,786,783 people shows a significant positive correlation between the proportion of Slavs and poverty level in the United States with a correlation coefficient (R) of 0.645 and weighted average of 11.5%, a difference of 6.1%.
Poverty Correlation Summary
| Measurement | Immigrants from Chile | Slavic |
| Minimum | 2.2% | 0.14% |
| Maximum | 29.7% | 44.1% |
| Range | 27.5% | 43.9% |
| Mean | 11.4% | 11.4% |
| Median | 10.0% | 10.1% |
| Interquartile 25% (IQ1) | 8.2% | 7.4% |
| Interquartile 75% (IQ3) | 13.8% | 13.2% |
| Interquartile Range (IQR) | 5.6% | 5.8% |
| Standard Deviation (Sample) | 5.8% | 8.2% |
| Standard Deviation (Population) | 5.7% | 8.1% |
Similar Demographics by Poverty
Demographics Similar to Immigrants from Chile by Poverty
In terms of poverty, the demographic groups most similar to Immigrants from Chile are Venezuelan (12.2%, a difference of 0.020%), Immigrants from Venezuela (12.2%, a difference of 0.020%), Colombian (12.2%, a difference of 0.11%), Immigrants from Albania (12.2%, a difference of 0.11%), and White/Caucasian (12.3%, a difference of 0.13%).
| Demographics | Rating | Rank | Poverty |
| Immigrants | Nepal | 60.4 /100 | #160 | Good 12.2% |
| Immigrants | Fiji | 59.1 /100 | #161 | Average 12.2% |
| Ethiopians | 59.1 /100 | #162 | Average 12.2% |
| Immigrants | Ethiopia | 58.6 /100 | #163 | Average 12.2% |
| Colombians | 57.8 /100 | #164 | Average 12.2% |
| Immigrants | Albania | 57.7 /100 | #165 | Average 12.2% |
| Venezuelans | 56.9 /100 | #166 | Average 12.2% |
| Immigrants | Chile | 56.7 /100 | #167 | Average 12.2% |
| Immigrants | Venezuela | 56.5 /100 | #168 | Average 12.2% |
| Whites/Caucasians | 55.4 /100 | #169 | Average 12.3% |
| Immigrants | Oceania | 54.6 /100 | #170 | Average 12.3% |
| Immigrants | Spain | 51.3 /100 | #171 | Average 12.3% |
| Immigrants | Portugal | 50.5 /100 | #172 | Average 12.3% |
| Celtics | 50.1 /100 | #173 | Average 12.3% |
| Lebanese | 50.0 /100 | #174 | Average 12.3% |
Demographics Similar to Slavs by Poverty
In terms of poverty, the demographic groups most similar to Slavs are Scottish (11.5%, a difference of 0.31%), Laotian (11.6%, a difference of 0.34%), Okinawan (11.6%, a difference of 0.34%), Immigrants from Indonesia (11.5%, a difference of 0.42%), and Native Hawaiian (11.6%, a difference of 0.45%).
| Demographics | Rating | Rank | Poverty |
| Paraguayans | 94.9 /100 | #94 | Exceptional 11.4% |
| Australians | 94.9 /100 | #95 | Exceptional 11.4% |
| Immigrants | South Africa | 94.7 /100 | #96 | Exceptional 11.5% |
| Immigrants | Egypt | 94.6 /100 | #97 | Exceptional 11.5% |
| Immigrants | Latvia | 94.5 /100 | #98 | Exceptional 11.5% |
| Immigrants | Indonesia | 94.2 /100 | #99 | Exceptional 11.5% |
| Scottish | 94.0 /100 | #100 | Exceptional 11.5% |
| Slavs | 93.3 /100 | #101 | Exceptional 11.5% |
| Laotians | 92.4 /100 | #102 | Exceptional 11.6% |
| Okinawans | 92.4 /100 | #103 | Exceptional 11.6% |
| Native Hawaiians | 92.1 /100 | #104 | Exceptional 11.6% |
| Portuguese | 92.1 /100 | #105 | Exceptional 11.6% |
| Immigrants | Zimbabwe | 92.1 /100 | #106 | Exceptional 11.6% |
| Palestinians | 91.8 /100 | #107 | Exceptional 11.6% |
| Canadians | 91.7 /100 | #108 | Exceptional 11.6% |