Fijian vs Soviet Union Poverty
COMPARE
Fijian
Soviet Union
Poverty
Poverty Comparison
Fijians
Soviet Union
13.7%
POVERTY
0.8/ 100
METRIC RATING
232nd/ 347
METRIC RANK
11.7%
POVERTY
88.4/ 100
METRIC RATING
124th/ 347
METRIC RANK
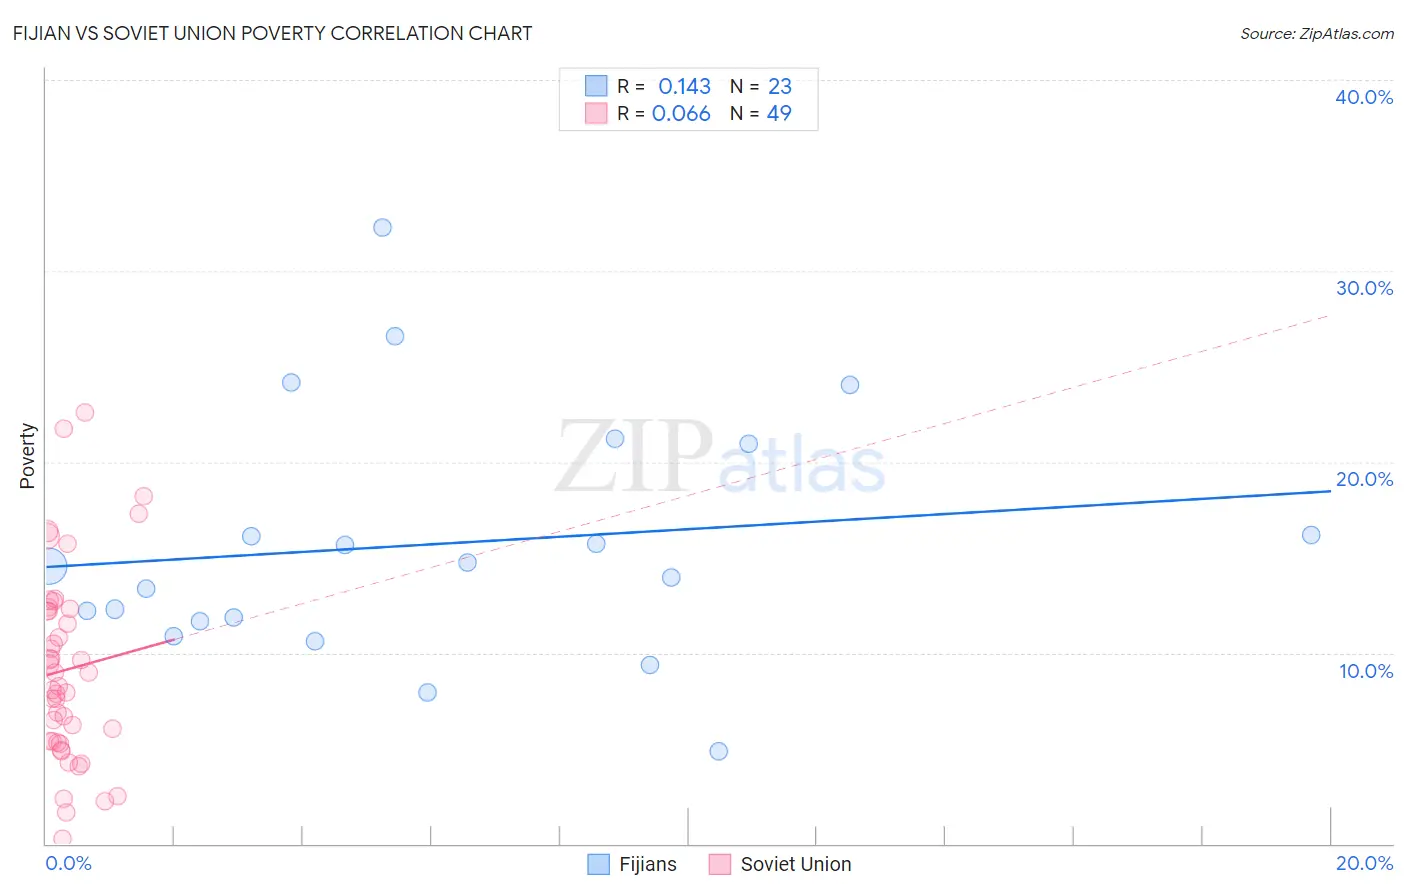
Fijian vs Soviet Union Poverty Correlation Chart
The statistical analysis conducted on geographies consisting of 55,947,896 people shows a poor positive correlation between the proportion of Fijians and poverty level in the United States with a correlation coefficient (R) of 0.143 and weighted average of 13.7%. Similarly, the statistical analysis conducted on geographies consisting of 43,449,399 people shows a slight positive correlation between the proportion of Soviet Union and poverty level in the United States with a correlation coefficient (R) of 0.066 and weighted average of 11.7%, a difference of 17.3%.
Poverty Correlation Summary
| Measurement | Fijian | Soviet Union |
| Minimum | 4.9% | 0.29% |
| Maximum | 32.3% | 22.6% |
| Range | 27.5% | 22.3% |
| Mean | 15.7% | 9.1% |
| Median | 14.5% | 8.3% |
| Interquartile 25% (IQ1) | 11.7% | 5.3% |
| Interquartile 75% (IQ3) | 21.0% | 12.3% |
| Interquartile Range (IQR) | 9.3% | 6.9% |
| Standard Deviation (Sample) | 6.5% | 5.0% |
| Standard Deviation (Population) | 6.3% | 5.0% |
Similar Demographics by Poverty
Demographics Similar to Fijians by Poverty
In terms of poverty, the demographic groups most similar to Fijians are Immigrants from Saudi Arabia (13.8%, a difference of 0.25%), Immigrants from Laos (13.8%, a difference of 0.49%), Cuban (13.9%, a difference of 0.93%), Immigrants from Armenia (13.9%, a difference of 0.96%), and French American Indian (13.9%, a difference of 0.98%).
| Demographics | Rating | Rank | Poverty |
| German Russians | 2.2 /100 | #225 | Tragic 13.4% |
| Marshallese | 2.2 /100 | #226 | Tragic 13.4% |
| Alaska Natives | 2.1 /100 | #227 | Tragic 13.5% |
| Immigrants | Nigeria | 1.7 /100 | #228 | Tragic 13.5% |
| Osage | 1.5 /100 | #229 | Tragic 13.6% |
| Alaskan Athabascans | 1.5 /100 | #230 | Tragic 13.6% |
| Nigerians | 1.4 /100 | #231 | Tragic 13.6% |
| Fijians | 0.8 /100 | #232 | Tragic 13.7% |
| Immigrants | Saudi Arabia | 0.8 /100 | #233 | Tragic 13.8% |
| Immigrants | Laos | 0.7 /100 | #234 | Tragic 13.8% |
| Cubans | 0.6 /100 | #235 | Tragic 13.9% |
| Immigrants | Armenia | 0.5 /100 | #236 | Tragic 13.9% |
| French American Indians | 0.5 /100 | #237 | Tragic 13.9% |
| Ghanaians | 0.5 /100 | #238 | Tragic 13.9% |
| Nicaraguans | 0.4 /100 | #239 | Tragic 13.9% |
Demographics Similar to Soviet Union by Poverty
In terms of poverty, the demographic groups most similar to Soviet Union are Immigrants from Brazil (11.7%, a difference of 0.040%), Immigrants from Hungary (11.7%, a difference of 0.070%), Immigrants from Norway (11.7%, a difference of 0.080%), New Zealander (11.7%, a difference of 0.090%), and Puget Sound Salish (11.7%, a difference of 0.090%).
| Demographics | Rating | Rank | Poverty |
| Sri Lankans | 89.4 /100 | #117 | Excellent 11.7% |
| Argentineans | 89.1 /100 | #118 | Excellent 11.7% |
| Tlingit-Haida | 89.0 /100 | #119 | Excellent 11.7% |
| Immigrants | South Eastern Asia | 88.9 /100 | #120 | Excellent 11.7% |
| New Zealanders | 88.7 /100 | #121 | Excellent 11.7% |
| Puget Sound Salish | 88.7 /100 | #122 | Excellent 11.7% |
| Immigrants | Hungary | 88.6 /100 | #123 | Excellent 11.7% |
| Soviet Union | 88.4 /100 | #124 | Excellent 11.7% |
| Immigrants | Brazil | 88.2 /100 | #125 | Excellent 11.7% |
| Immigrants | Norway | 88.0 /100 | #126 | Excellent 11.7% |
| Immigrants | Argentina | 88.0 /100 | #127 | Excellent 11.7% |
| Immigrants | Israel | 87.4 /100 | #128 | Excellent 11.7% |
| South Africans | 87.0 /100 | #129 | Excellent 11.7% |
| Immigrants | Ukraine | 86.6 /100 | #130 | Excellent 11.8% |
| French | 86.1 /100 | #131 | Excellent 11.8% |