Polish vs Slavic Poverty
COMPARE
Polish
Slavic
Poverty
Poverty Comparison
Poles
Slavs
10.7%
POVERTY
99.5/ 100
METRIC RATING
31st/ 347
METRIC RANK
11.5%
POVERTY
93.3/ 100
METRIC RATING
101st/ 347
METRIC RANK
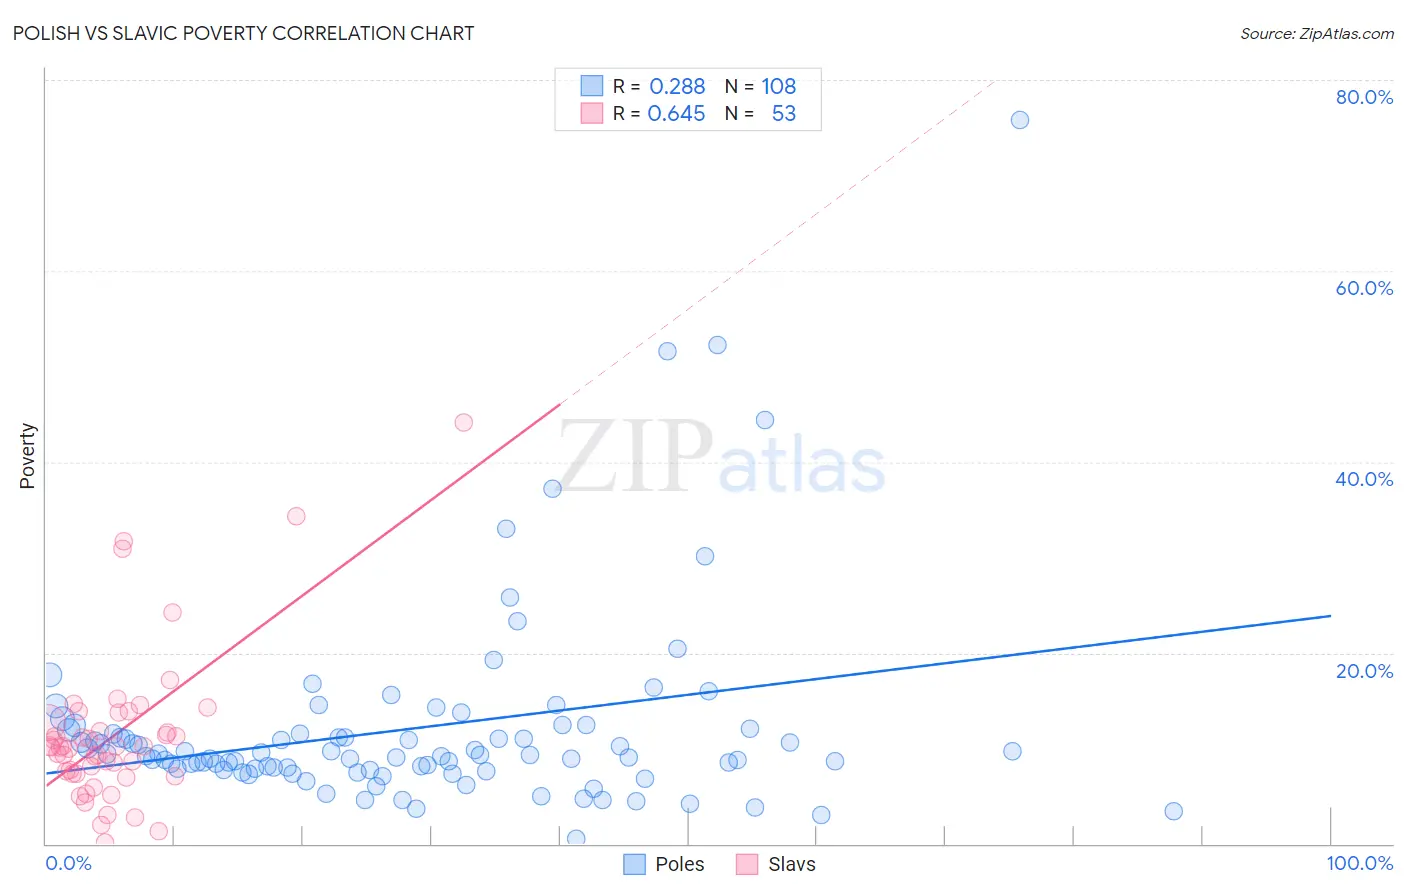
Polish vs Slavic Poverty Correlation Chart
The statistical analysis conducted on geographies consisting of 559,734,720 people shows a weak positive correlation between the proportion of Poles and poverty level in the United States with a correlation coefficient (R) of 0.288 and weighted average of 10.7%. Similarly, the statistical analysis conducted on geographies consisting of 270,786,783 people shows a significant positive correlation between the proportion of Slavs and poverty level in the United States with a correlation coefficient (R) of 0.645 and weighted average of 11.5%, a difference of 7.4%.
Poverty Correlation Summary
| Measurement | Polish | Slavic |
| Minimum | 0.55% | 0.14% |
| Maximum | 75.7% | 44.1% |
| Range | 75.2% | 43.9% |
| Mean | 12.1% | 11.4% |
| Median | 9.2% | 10.1% |
| Interquartile 25% (IQ1) | 7.8% | 7.4% |
| Interquartile 75% (IQ3) | 11.7% | 13.2% |
| Interquartile Range (IQR) | 3.9% | 5.8% |
| Standard Deviation (Sample) | 10.5% | 8.2% |
| Standard Deviation (Population) | 10.5% | 8.1% |
Similar Demographics by Poverty
Demographics Similar to Poles by Poverty
In terms of poverty, the demographic groups most similar to Poles are Danish (10.7%, a difference of 0.080%), Greek (10.7%, a difference of 0.090%), Iranian (10.7%, a difference of 0.090%), Immigrants from Korea (10.7%, a difference of 0.19%), and Immigrants from Northern Europe (10.7%, a difference of 0.25%).
| Demographics | Rating | Rank | Poverty |
| Italians | 99.7 /100 | #24 | Exceptional 10.6% |
| Croatians | 99.6 /100 | #25 | Exceptional 10.6% |
| Burmese | 99.6 /100 | #26 | Exceptional 10.7% |
| Immigrants | Northern Europe | 99.6 /100 | #27 | Exceptional 10.7% |
| Immigrants | Korea | 99.5 /100 | #28 | Exceptional 10.7% |
| Greeks | 99.5 /100 | #29 | Exceptional 10.7% |
| Danes | 99.5 /100 | #30 | Exceptional 10.7% |
| Poles | 99.5 /100 | #31 | Exceptional 10.7% |
| Iranians | 99.5 /100 | #32 | Exceptional 10.7% |
| Macedonians | 99.4 /100 | #33 | Exceptional 10.8% |
| Immigrants | Poland | 99.4 /100 | #34 | Exceptional 10.8% |
| Tongans | 99.4 /100 | #35 | Exceptional 10.8% |
| Cypriots | 99.3 /100 | #36 | Exceptional 10.8% |
| Immigrants | Greece | 99.3 /100 | #37 | Exceptional 10.8% |
| Czechs | 99.3 /100 | #38 | Exceptional 10.8% |
Demographics Similar to Slavs by Poverty
In terms of poverty, the demographic groups most similar to Slavs are Scottish (11.5%, a difference of 0.31%), Laotian (11.6%, a difference of 0.34%), Okinawan (11.6%, a difference of 0.34%), Immigrants from Indonesia (11.5%, a difference of 0.42%), and Native Hawaiian (11.6%, a difference of 0.45%).
| Demographics | Rating | Rank | Poverty |
| Paraguayans | 94.9 /100 | #94 | Exceptional 11.4% |
| Australians | 94.9 /100 | #95 | Exceptional 11.4% |
| Immigrants | South Africa | 94.7 /100 | #96 | Exceptional 11.5% |
| Immigrants | Egypt | 94.6 /100 | #97 | Exceptional 11.5% |
| Immigrants | Latvia | 94.5 /100 | #98 | Exceptional 11.5% |
| Immigrants | Indonesia | 94.2 /100 | #99 | Exceptional 11.5% |
| Scottish | 94.0 /100 | #100 | Exceptional 11.5% |
| Slavs | 93.3 /100 | #101 | Exceptional 11.5% |
| Laotians | 92.4 /100 | #102 | Exceptional 11.6% |
| Okinawans | 92.4 /100 | #103 | Exceptional 11.6% |
| Native Hawaiians | 92.1 /100 | #104 | Exceptional 11.6% |
| Portuguese | 92.1 /100 | #105 | Exceptional 11.6% |
| Immigrants | Zimbabwe | 92.1 /100 | #106 | Exceptional 11.6% |
| Palestinians | 91.8 /100 | #107 | Exceptional 11.6% |
| Canadians | 91.7 /100 | #108 | Exceptional 11.6% |