Ecuadorian vs Japanese Median Male Earnings
COMPARE
Ecuadorian
Japanese
Median Male Earnings
Median Male Earnings Comparison
Ecuadorians
Japanese
$51,596
MEDIAN MALE EARNINGS
5.5/ 100
METRIC RATING
223rd/ 347
METRIC RANK
$51,473
MEDIAN MALE EARNINGS
4.9/ 100
METRIC RATING
226th/ 347
METRIC RANK
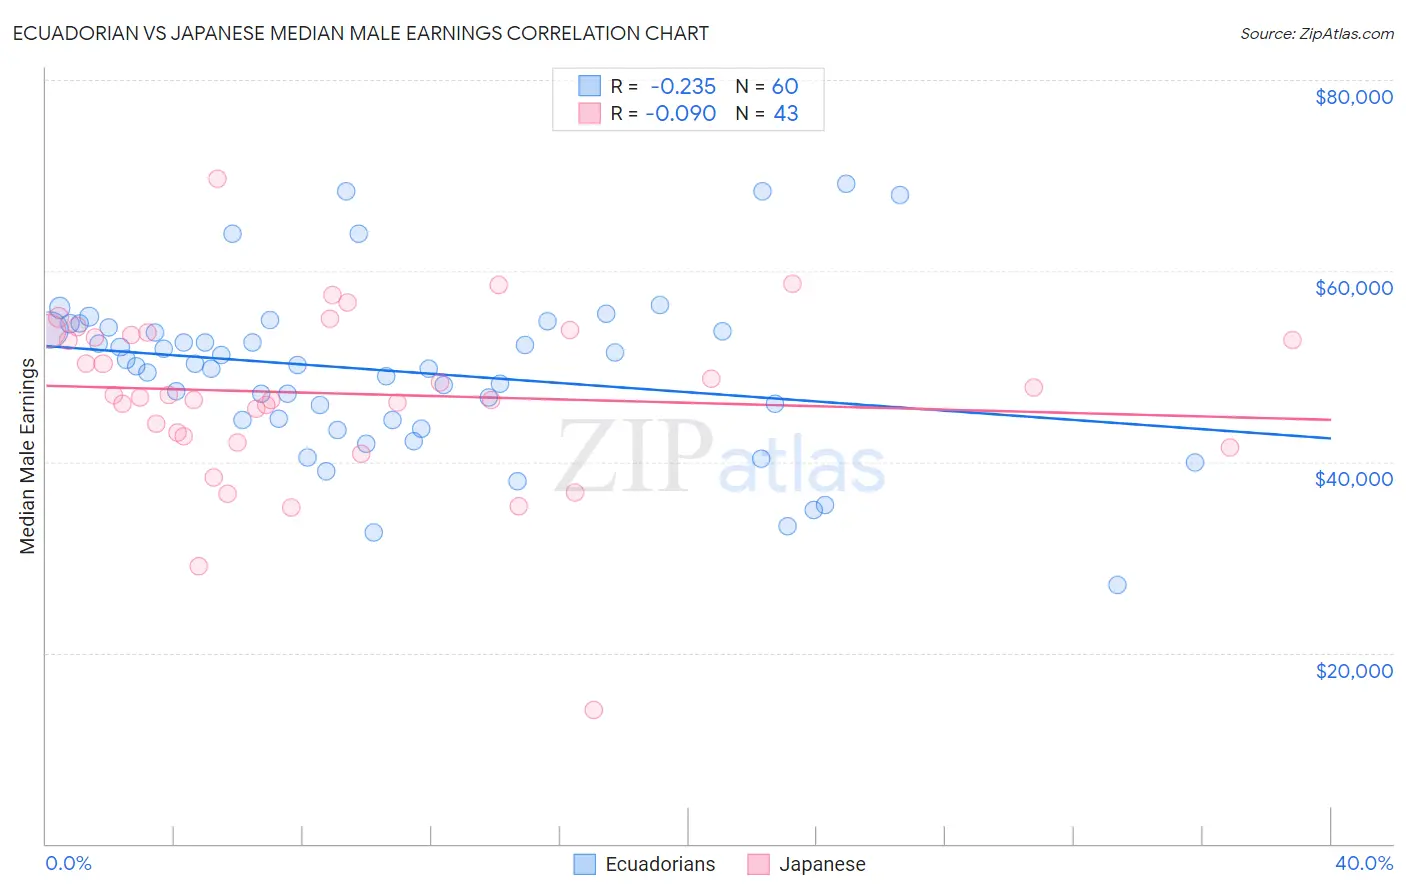
Ecuadorian vs Japanese Median Male Earnings Correlation Chart
The statistical analysis conducted on geographies consisting of 317,782,884 people shows a weak negative correlation between the proportion of Ecuadorians and median male earnings in the United States with a correlation coefficient (R) of -0.235 and weighted average of $51,596. Similarly, the statistical analysis conducted on geographies consisting of 249,157,630 people shows a slight negative correlation between the proportion of Japanese and median male earnings in the United States with a correlation coefficient (R) of -0.090 and weighted average of $51,473, a difference of 0.24%.
Median Male Earnings Correlation Summary
| Measurement | Ecuadorian | Japanese |
| Minimum | $27,125 | $14,032 |
| Maximum | $69,080 | $69,626 |
| Range | $41,955 | $55,594 |
| Mean | $49,474 | $47,153 |
| Median | $50,085 | $47,032 |
| Interquartile 25% (IQ1) | $44,427 | $42,663 |
| Interquartile 75% (IQ3) | $53,952 | $53,598 |
| Interquartile Range (IQR) | $9,525 | $10,935 |
| Standard Deviation (Sample) | $8,750 | $9,237 |
| Standard Deviation (Population) | $8,677 | $9,129 |
Demographics Similar to Ecuadorians and Japanese by Median Male Earnings
In terms of median male earnings, the demographic groups most similar to Ecuadorians are Immigrants from Cambodia ($51,594, a difference of 0.0%), Immigrants from Bangladesh ($51,642, a difference of 0.090%), Immigrants from Senegal ($51,647, a difference of 0.10%), Immigrants from Sudan ($51,489, a difference of 0.21%), and Trinidadian and Tobagonian ($51,446, a difference of 0.29%). Similarly, the demographic groups most similar to Japanese are Immigrants from Sudan ($51,489, a difference of 0.030%), Trinidadian and Tobagonian ($51,446, a difference of 0.050%), Samoan ($51,389, a difference of 0.16%), Immigrants from Trinidad and Tobago ($51,376, a difference of 0.19%), and Immigrants from Cambodia ($51,594, a difference of 0.23%).
| Demographics | Rating | Rank | Median Male Earnings |
| Immigrants | Nonimmigrants | 9.3 /100 | #214 | Tragic $52,170 |
| Immigrants | Cameroon | 8.9 /100 | #215 | Tragic $52,119 |
| Immigrants | Venezuela | 8.3 /100 | #216 | Tragic $52,041 |
| Nigerians | 8.3 /100 | #217 | Tragic $52,039 |
| Immigrants | Panama | 7.7 /100 | #218 | Tragic $51,962 |
| Immigrants | Ghana | 6.9 /100 | #219 | Tragic $51,836 |
| Immigrants | Armenia | 6.6 /100 | #220 | Tragic $51,793 |
| Immigrants | Senegal | 5.8 /100 | #221 | Tragic $51,647 |
| Immigrants | Bangladesh | 5.8 /100 | #222 | Tragic $51,642 |
| Ecuadorians | 5.5 /100 | #223 | Tragic $51,596 |
| Immigrants | Cambodia | 5.5 /100 | #224 | Tragic $51,594 |
| Immigrants | Sudan | 5.0 /100 | #225 | Tragic $51,489 |
| Japanese | 4.9 /100 | #226 | Tragic $51,473 |
| Trinidadians and Tobagonians | 4.8 /100 | #227 | Tragic $51,446 |
| Samoans | 4.6 /100 | #228 | Tragic $51,389 |
| Immigrants | Trinidad and Tobago | 4.5 /100 | #229 | Tragic $51,376 |
| Immigrants | Nigeria | 4.2 /100 | #230 | Tragic $51,310 |
| Barbadians | 3.9 /100 | #231 | Tragic $51,236 |
| Sudanese | 3.9 /100 | #232 | Tragic $51,216 |
| Aleuts | 3.7 /100 | #233 | Tragic $51,168 |
| Cape Verdeans | 3.5 /100 | #234 | Tragic $51,103 |