Ecuadorian vs Immigrants from Fiji Family Poverty
COMPARE
Ecuadorian
Immigrants from Fiji
Family Poverty
Family Poverty Comparison
Ecuadorians
Immigrants from Fiji
10.8%
FAMILY POVERTY
0.2/ 100
METRIC RATING
254th/ 347
METRIC RANK
8.9%
FAMILY POVERTY
56.4/ 100
METRIC RATING
173rd/ 347
METRIC RANK
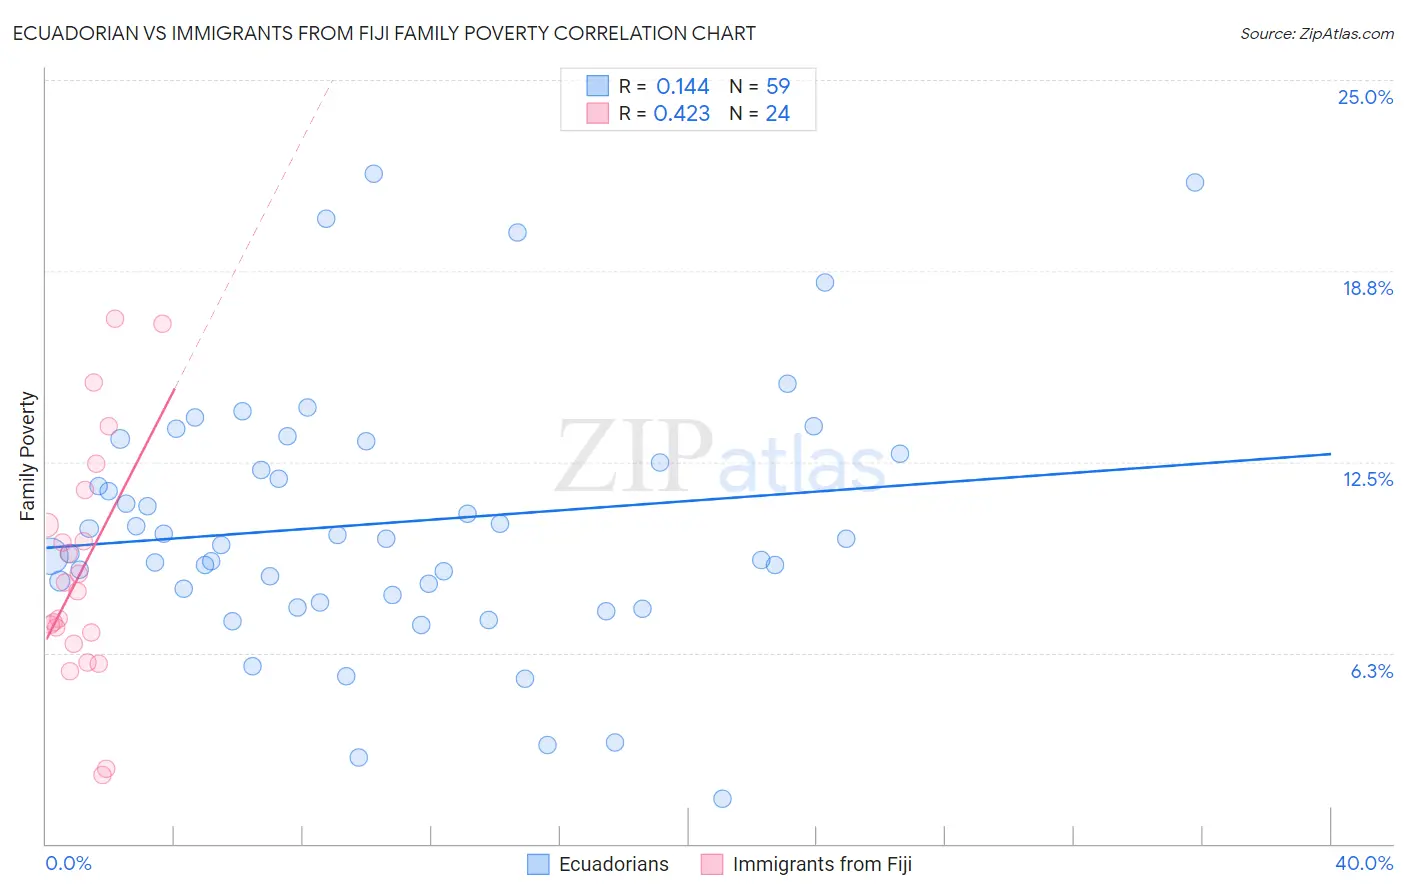
Ecuadorian vs Immigrants from Fiji Family Poverty Correlation Chart
The statistical analysis conducted on geographies consisting of 317,108,203 people shows a poor positive correlation between the proportion of Ecuadorians and poverty level among families in the United States with a correlation coefficient (R) of 0.144 and weighted average of 10.8%. Similarly, the statistical analysis conducted on geographies consisting of 93,742,503 people shows a moderate positive correlation between the proportion of Immigrants from Fiji and poverty level among families in the United States with a correlation coefficient (R) of 0.423 and weighted average of 8.9%, a difference of 20.7%.
Family Poverty Correlation Summary
| Measurement | Ecuadorian | Immigrants from Fiji |
| Minimum | 1.5% | 2.3% |
| Maximum | 21.9% | 17.2% |
| Range | 20.5% | 14.9% |
| Mean | 10.5% | 9.0% |
| Median | 10.0% | 8.4% |
| Interquartile 25% (IQ1) | 8.1% | 6.7% |
| Interquartile 75% (IQ3) | 12.8% | 11.0% |
| Interquartile Range (IQR) | 4.6% | 4.3% |
| Standard Deviation (Sample) | 4.2% | 3.9% |
| Standard Deviation (Population) | 4.2% | 3.8% |
Similar Demographics by Family Poverty
Demographics Similar to Ecuadorians by Family Poverty
In terms of family poverty, the demographic groups most similar to Ecuadorians are Immigrants from Western Africa (10.7%, a difference of 0.30%), Immigrants from Liberia (10.8%, a difference of 0.37%), Immigrants from Zaire (10.7%, a difference of 0.41%), Iroquois (10.7%, a difference of 0.53%), and Chickasaw (10.8%, a difference of 0.64%).
| Demographics | Rating | Rank | Family Poverty |
| Liberians | 0.4 /100 | #247 | Tragic 10.6% |
| Nicaraguans | 0.4 /100 | #248 | Tragic 10.6% |
| Cubans | 0.4 /100 | #249 | Tragic 10.6% |
| Salvadorans | 0.3 /100 | #250 | Tragic 10.7% |
| Iroquois | 0.3 /100 | #251 | Tragic 10.7% |
| Immigrants | Zaire | 0.3 /100 | #252 | Tragic 10.7% |
| Immigrants | Western Africa | 0.3 /100 | #253 | Tragic 10.7% |
| Ecuadorians | 0.2 /100 | #254 | Tragic 10.8% |
| Immigrants | Liberia | 0.2 /100 | #255 | Tragic 10.8% |
| Chickasaw | 0.2 /100 | #256 | Tragic 10.8% |
| Immigrants | Ghana | 0.2 /100 | #257 | Tragic 10.8% |
| Sub-Saharan Africans | 0.2 /100 | #258 | Tragic 10.9% |
| Mexican American Indians | 0.2 /100 | #259 | Tragic 10.9% |
| Bangladeshis | 0.2 /100 | #260 | Tragic 10.9% |
| Shoshone | 0.2 /100 | #261 | Tragic 10.9% |
Demographics Similar to Immigrants from Fiji by Family Poverty
In terms of family poverty, the demographic groups most similar to Immigrants from Fiji are Immigrants from Peru (8.9%, a difference of 0.15%), Lebanese (8.9%, a difference of 0.16%), Kenyan (8.9%, a difference of 0.25%), Immigrants from Chile (8.9%, a difference of 0.44%), and Israeli (8.9%, a difference of 0.79%).
| Demographics | Rating | Rank | Family Poverty |
| Afghans | 63.5 /100 | #166 | Good 8.8% |
| Immigrants | Ethiopia | 62.5 /100 | #167 | Good 8.9% |
| Israelis | 62.1 /100 | #168 | Good 8.9% |
| Immigrants | Chile | 59.6 /100 | #169 | Average 8.9% |
| Kenyans | 58.2 /100 | #170 | Average 8.9% |
| Lebanese | 57.6 /100 | #171 | Average 8.9% |
| Immigrants | Peru | 57.5 /100 | #172 | Average 8.9% |
| Immigrants | Fiji | 56.4 /100 | #173 | Average 8.9% |
| Immigrants | Albania | 50.0 /100 | #174 | Average 9.0% |
| Costa Ricans | 49.3 /100 | #175 | Average 9.0% |
| Immigrants | Syria | 47.5 /100 | #176 | Average 9.0% |
| Hawaiians | 47.2 /100 | #177 | Average 9.0% |
| Immigrants | Cameroon | 47.1 /100 | #178 | Average 9.0% |
| Immigrants | Iraq | 44.4 /100 | #179 | Average 9.1% |
| Immigrants | Uganda | 43.4 /100 | #180 | Average 9.1% |