Ecuadorian vs Puget Sound Salish Family Poverty
COMPARE
Ecuadorian
Puget Sound Salish
Family Poverty
Family Poverty Comparison
Ecuadorians
Puget Sound Salish
10.8%
FAMILY POVERTY
0.2/ 100
METRIC RATING
254th/ 347
METRIC RANK
8.4%
FAMILY POVERTY
88.6/ 100
METRIC RATING
131st/ 347
METRIC RANK
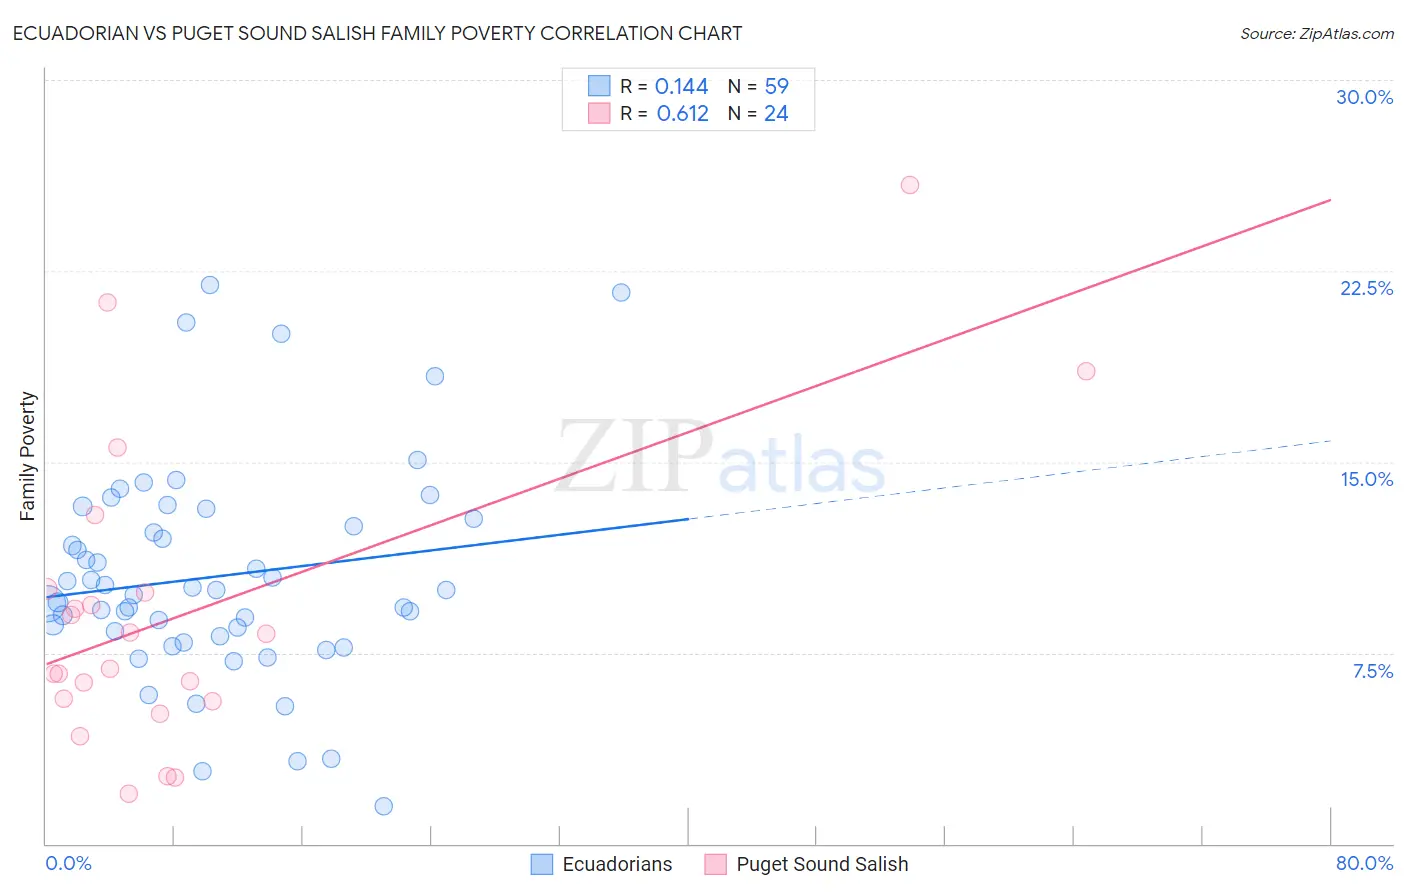
Ecuadorian vs Puget Sound Salish Family Poverty Correlation Chart
The statistical analysis conducted on geographies consisting of 317,108,203 people shows a poor positive correlation between the proportion of Ecuadorians and poverty level among families in the United States with a correlation coefficient (R) of 0.144 and weighted average of 10.8%. Similarly, the statistical analysis conducted on geographies consisting of 46,127,030 people shows a significant positive correlation between the proportion of Puget Sound Salish and poverty level among families in the United States with a correlation coefficient (R) of 0.612 and weighted average of 8.4%, a difference of 28.3%.
Family Poverty Correlation Summary
| Measurement | Ecuadorian | Puget Sound Salish |
| Minimum | 1.5% | 2.0% |
| Maximum | 21.9% | 25.9% |
| Range | 20.5% | 23.9% |
| Mean | 10.5% | 9.1% |
| Median | 10.0% | 7.6% |
| Interquartile 25% (IQ1) | 8.1% | 5.7% |
| Interquartile 75% (IQ3) | 12.8% | 9.9% |
| Interquartile Range (IQR) | 4.6% | 4.3% |
| Standard Deviation (Sample) | 4.2% | 5.9% |
| Standard Deviation (Population) | 4.2% | 5.8% |
Similar Demographics by Family Poverty
Demographics Similar to Ecuadorians by Family Poverty
In terms of family poverty, the demographic groups most similar to Ecuadorians are Immigrants from Western Africa (10.7%, a difference of 0.30%), Immigrants from Liberia (10.8%, a difference of 0.37%), Immigrants from Zaire (10.7%, a difference of 0.41%), Iroquois (10.7%, a difference of 0.53%), and Chickasaw (10.8%, a difference of 0.64%).
| Demographics | Rating | Rank | Family Poverty |
| Liberians | 0.4 /100 | #247 | Tragic 10.6% |
| Nicaraguans | 0.4 /100 | #248 | Tragic 10.6% |
| Cubans | 0.4 /100 | #249 | Tragic 10.6% |
| Salvadorans | 0.3 /100 | #250 | Tragic 10.7% |
| Iroquois | 0.3 /100 | #251 | Tragic 10.7% |
| Immigrants | Zaire | 0.3 /100 | #252 | Tragic 10.7% |
| Immigrants | Western Africa | 0.3 /100 | #253 | Tragic 10.7% |
| Ecuadorians | 0.2 /100 | #254 | Tragic 10.8% |
| Immigrants | Liberia | 0.2 /100 | #255 | Tragic 10.8% |
| Chickasaw | 0.2 /100 | #256 | Tragic 10.8% |
| Immigrants | Ghana | 0.2 /100 | #257 | Tragic 10.8% |
| Sub-Saharan Africans | 0.2 /100 | #258 | Tragic 10.9% |
| Mexican American Indians | 0.2 /100 | #259 | Tragic 10.9% |
| Bangladeshis | 0.2 /100 | #260 | Tragic 10.9% |
| Shoshone | 0.2 /100 | #261 | Tragic 10.9% |
Demographics Similar to Puget Sound Salish by Family Poverty
In terms of family poverty, the demographic groups most similar to Puget Sound Salish are Immigrants from Bosnia and Herzegovina (8.4%, a difference of 0.010%), Immigrants from Argentina (8.4%, a difference of 0.15%), Portuguese (8.4%, a difference of 0.19%), Argentinean (8.4%, a difference of 0.35%), and Immigrants from Hungary (8.4%, a difference of 0.49%).
| Demographics | Rating | Rank | Family Poverty |
| Soviet Union | 90.8 /100 | #124 | Exceptional 8.3% |
| Pakistanis | 90.8 /100 | #125 | Exceptional 8.3% |
| Icelanders | 90.3 /100 | #126 | Exceptional 8.3% |
| Immigrants | Hungary | 89.9 /100 | #127 | Excellent 8.4% |
| Argentineans | 89.6 /100 | #128 | Excellent 8.4% |
| Portuguese | 89.2 /100 | #129 | Excellent 8.4% |
| Immigrants | Bosnia and Herzegovina | 88.6 /100 | #130 | Excellent 8.4% |
| Puget Sound Salish | 88.6 /100 | #131 | Excellent 8.4% |
| Immigrants | Argentina | 88.2 /100 | #132 | Excellent 8.4% |
| Sri Lankans | 86.6 /100 | #133 | Excellent 8.5% |
| Chileans | 86.6 /100 | #134 | Excellent 8.5% |
| Immigrants | Malaysia | 86.5 /100 | #135 | Excellent 8.5% |
| Immigrants | Brazil | 86.3 /100 | #136 | Excellent 8.5% |
| Immigrants | Southern Europe | 86.0 /100 | #137 | Excellent 8.5% |
| Armenians | 84.6 /100 | #138 | Excellent 8.5% |