Dutch vs Immigrants from Singapore Unemployment Among Ages 45 to 54 years
COMPARE
Dutch
Immigrants from Singapore
Unemployment Among Ages 45 to 54 years
Unemployment Among Ages 45 to 54 years Comparison
Dutch
Immigrants from Singapore
4.2%
UNEMPLOYMENT AMONG AGES 45 TO 54 YEARS
99.9/ 100
METRIC RATING
34th/ 347
METRIC RANK
4.2%
UNEMPLOYMENT AMONG AGES 45 TO 54 YEARS
99.7/ 100
METRIC RATING
44th/ 347
METRIC RANK
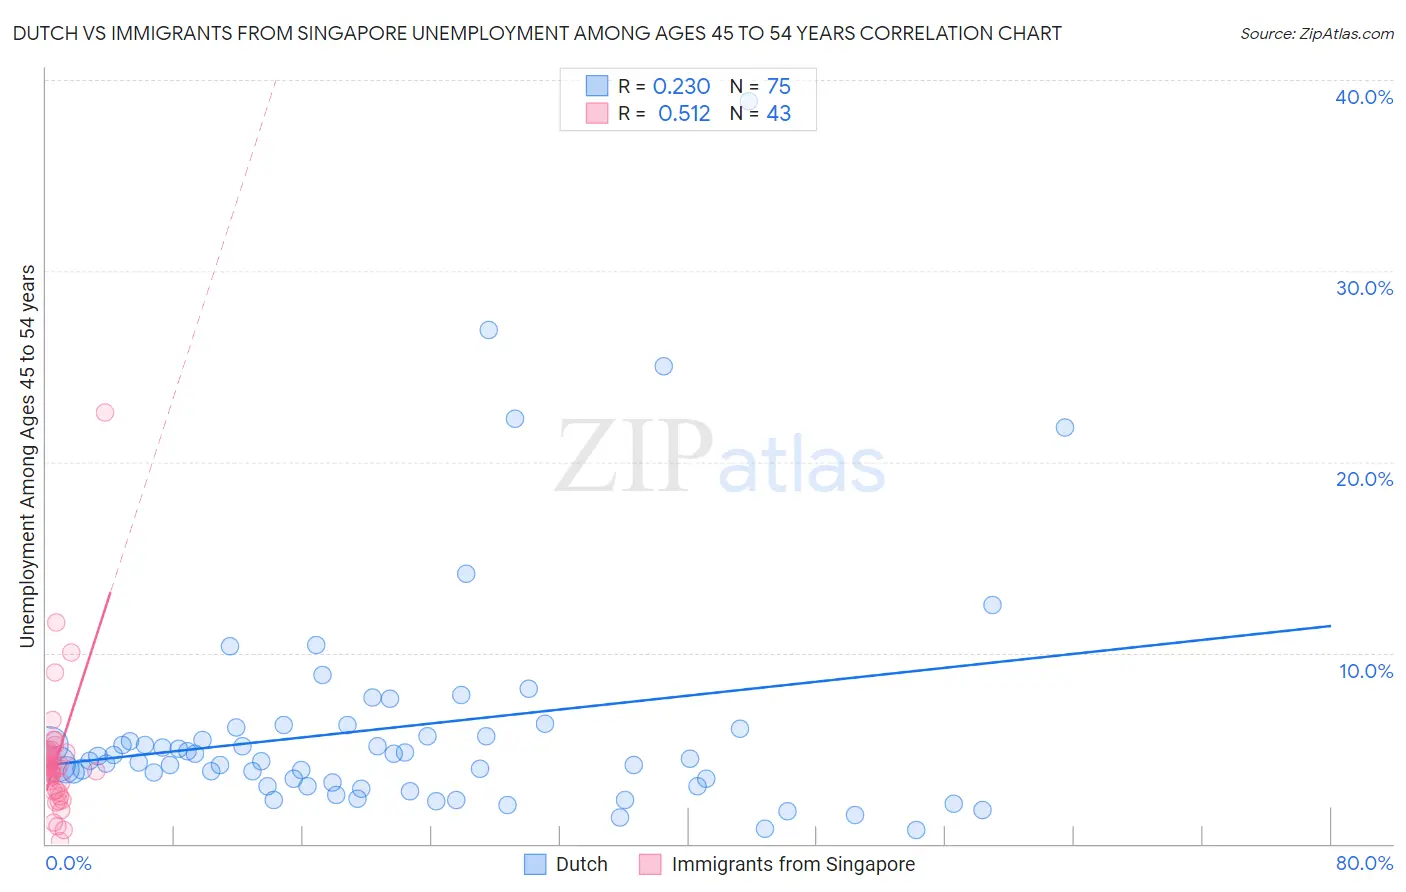
Dutch vs Immigrants from Singapore Unemployment Among Ages 45 to 54 years Correlation Chart
The statistical analysis conducted on geographies consisting of 515,631,224 people shows a weak positive correlation between the proportion of Dutch and unemployment rate among population between the ages 45 and 54 in the United States with a correlation coefficient (R) of 0.230 and weighted average of 4.2%. Similarly, the statistical analysis conducted on geographies consisting of 136,449,978 people shows a substantial positive correlation between the proportion of Immigrants from Singapore and unemployment rate among population between the ages 45 and 54 in the United States with a correlation coefficient (R) of 0.512 and weighted average of 4.2%, a difference of 0.91%.
Unemployment Among Ages 45 to 54 years Correlation Summary
| Measurement | Dutch | Immigrants from Singapore |
| Minimum | 0.70% | 0.10% |
| Maximum | 38.9% | 22.6% |
| Range | 38.2% | 22.5% |
| Mean | 6.1% | 4.5% |
| Median | 4.3% | 4.0% |
| Interquartile 25% (IQ1) | 3.0% | 2.7% |
| Interquartile 75% (IQ3) | 6.0% | 4.8% |
| Interquartile Range (IQR) | 3.0% | 2.1% |
| Standard Deviation (Sample) | 6.3% | 3.6% |
| Standard Deviation (Population) | 6.3% | 3.5% |
Demographics Similar to Dutch and Immigrants from Singapore by Unemployment Among Ages 45 to 54 years
In terms of unemployment among ages 45 to 54 years, the demographic groups most similar to Dutch are Immigrants from Taiwan (4.2%, a difference of 0.19%), Croatian (4.2%, a difference of 0.19%), Osage (4.2%, a difference of 0.21%), Scotch-Irish (4.2%, a difference of 0.23%), and Jordanian (4.2%, a difference of 0.38%). Similarly, the demographic groups most similar to Immigrants from Singapore are Immigrants from Bulgaria (4.2%, a difference of 0.15%), Luxembourger (4.2%, a difference of 0.24%), Filipino (4.2%, a difference of 0.25%), Zimbabwean (4.2%, a difference of 0.26%), and Immigrants from Scotland (4.2%, a difference of 0.27%).
| Demographics | Rating | Rank | Unemployment Among Ages 45 to 54 years |
| Belgians | 99.9 /100 | #29 | Exceptional 4.1% |
| British | 99.9 /100 | #30 | Exceptional 4.1% |
| Bhutanese | 99.9 /100 | #31 | Exceptional 4.2% |
| Slovenes | 99.9 /100 | #32 | Exceptional 4.2% |
| Immigrants | South Central Asia | 99.9 /100 | #33 | Exceptional 4.2% |
| Dutch | 99.9 /100 | #34 | Exceptional 4.2% |
| Immigrants | Taiwan | 99.8 /100 | #35 | Exceptional 4.2% |
| Croatians | 99.8 /100 | #36 | Exceptional 4.2% |
| Osage | 99.8 /100 | #37 | Exceptional 4.2% |
| Scotch-Irish | 99.8 /100 | #38 | Exceptional 4.2% |
| Jordanians | 99.8 /100 | #39 | Exceptional 4.2% |
| Northern Europeans | 99.8 /100 | #40 | Exceptional 4.2% |
| Czechoslovakians | 99.8 /100 | #41 | Exceptional 4.2% |
| Immigrants | Scotland | 99.8 /100 | #42 | Exceptional 4.2% |
| Zimbabweans | 99.8 /100 | #43 | Exceptional 4.2% |
| Immigrants | Singapore | 99.7 /100 | #44 | Exceptional 4.2% |
| Immigrants | Bulgaria | 99.7 /100 | #45 | Exceptional 4.2% |
| Luxembourgers | 99.6 /100 | #46 | Exceptional 4.2% |
| Filipinos | 99.6 /100 | #47 | Exceptional 4.2% |
| Finns | 99.6 /100 | #48 | Exceptional 4.2% |
| Immigrants | Zimbabwe | 99.6 /100 | #49 | Exceptional 4.2% |