Dutch vs Immigrants from Singapore Family Households
COMPARE
Dutch
Immigrants from Singapore
Family Households
Family Households Comparison
Dutch
Immigrants from Singapore
64.9%
FAMILY HOUSEHOLDS
95.1/ 100
METRIC RATING
118th/ 347
METRIC RANK
63.1%
FAMILY HOUSEHOLDS
0.4/ 100
METRIC RATING
268th/ 347
METRIC RANK
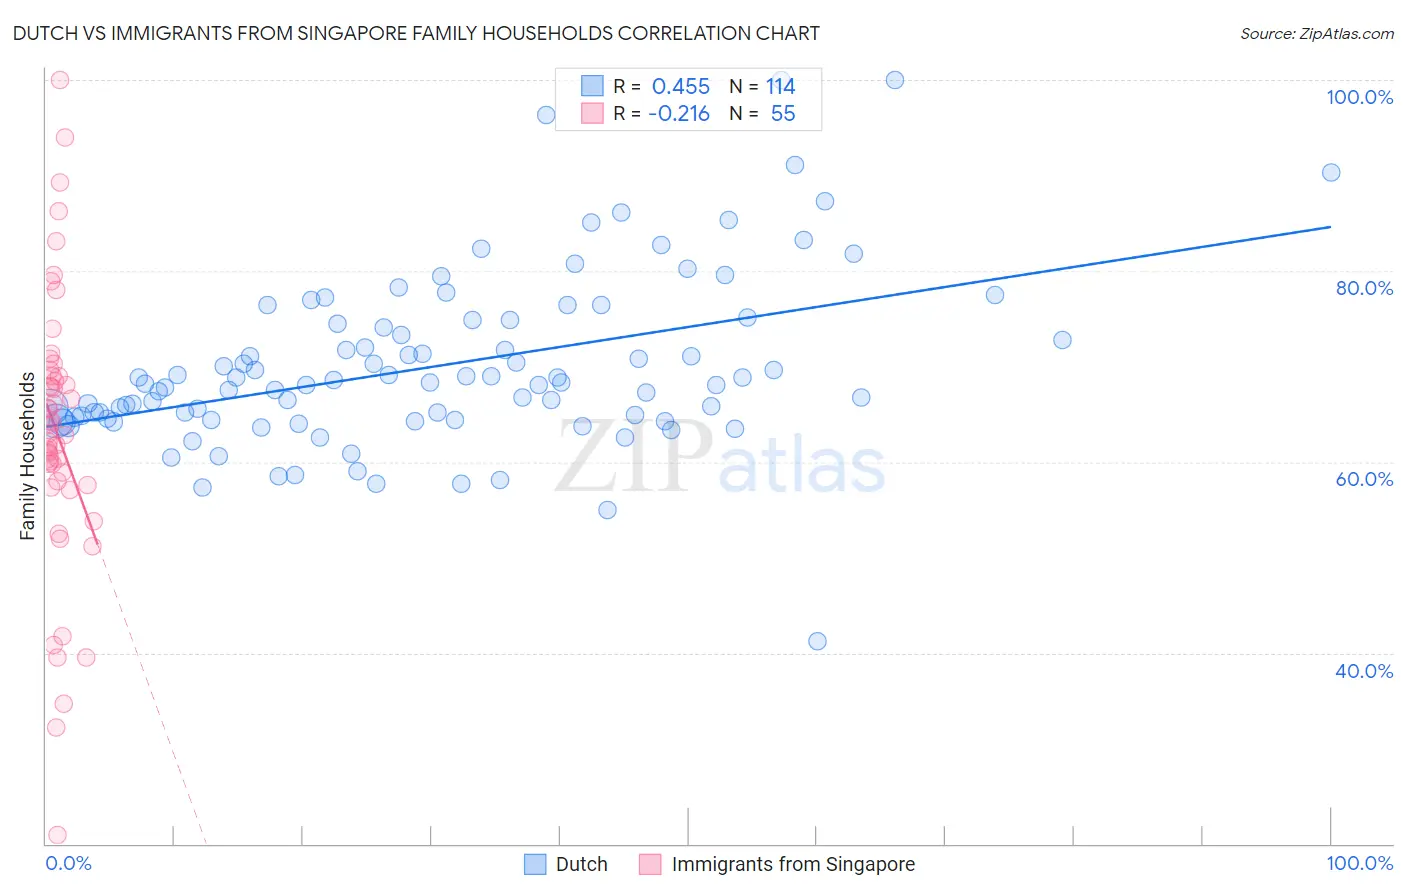
Dutch vs Immigrants from Singapore Family Households Correlation Chart
The statistical analysis conducted on geographies consisting of 553,876,441 people shows a moderate positive correlation between the proportion of Dutch and percentage of family households in the United States with a correlation coefficient (R) of 0.455 and weighted average of 64.9%. Similarly, the statistical analysis conducted on geographies consisting of 137,456,675 people shows a weak negative correlation between the proportion of Immigrants from Singapore and percentage of family households in the United States with a correlation coefficient (R) of -0.216 and weighted average of 63.1%, a difference of 2.9%.
Family Households Correlation Summary
| Measurement | Dutch | Immigrants from Singapore |
| Minimum | 41.2% | 20.9% |
| Maximum | 100.0% | 100.0% |
| Range | 58.8% | 79.1% |
| Mean | 70.0% | 62.9% |
| Median | 68.2% | 62.9% |
| Interquartile 25% (IQ1) | 64.5% | 57.5% |
| Interquartile 75% (IQ3) | 74.5% | 69.0% |
| Interquartile Range (IQR) | 9.9% | 11.5% |
| Standard Deviation (Sample) | 9.1% | 14.6% |
| Standard Deviation (Population) | 9.1% | 14.5% |
Similar Demographics by Family Households
Demographics Similar to Dutch by Family Households
In terms of family households, the demographic groups most similar to Dutch are Ecuadorian (65.0%, a difference of 0.020%), Immigrants from Iraq (65.0%, a difference of 0.020%), Cherokee (65.0%, a difference of 0.020%), Immigrants from Eastern Asia (64.9%, a difference of 0.040%), and Argentinean (65.0%, a difference of 0.050%).
| Demographics | Rating | Rank | Family Households |
| Europeans | 96.8 /100 | #111 | Exceptional 65.0% |
| Immigrants | Jordan | 96.5 /100 | #112 | Exceptional 65.0% |
| Spanish | 96.2 /100 | #113 | Exceptional 65.0% |
| Argentineans | 95.7 /100 | #114 | Exceptional 65.0% |
| Ecuadorians | 95.4 /100 | #115 | Exceptional 65.0% |
| Immigrants | Iraq | 95.4 /100 | #116 | Exceptional 65.0% |
| Cherokee | 95.3 /100 | #117 | Exceptional 65.0% |
| Dutch | 95.1 /100 | #118 | Exceptional 64.9% |
| Immigrants | Eastern Asia | 94.4 /100 | #119 | Exceptional 64.9% |
| Immigrants | Oceania | 94.2 /100 | #120 | Exceptional 64.9% |
| Hungarians | 94.0 /100 | #121 | Exceptional 64.9% |
| Hmong | 93.4 /100 | #122 | Exceptional 64.9% |
| Choctaw | 93.4 /100 | #123 | Exceptional 64.9% |
| Immigrants | Argentina | 92.8 /100 | #124 | Exceptional 64.9% |
| Immigrants | Belize | 92.7 /100 | #125 | Exceptional 64.9% |
Demographics Similar to Immigrants from Singapore by Family Households
In terms of family households, the demographic groups most similar to Immigrants from Singapore are Yugoslavian (63.1%, a difference of 0.0%), Immigrants from Austria (63.1%, a difference of 0.020%), Immigrants from Croatia (63.1%, a difference of 0.030%), Immigrants from Turkey (63.1%, a difference of 0.030%), and Immigrants from Kazakhstan (63.1%, a difference of 0.040%).
| Demographics | Rating | Rank | Family Households |
| Immigrants | Russia | 0.6 /100 | #261 | Tragic 63.2% |
| Immigrants | Ireland | 0.6 /100 | #262 | Tragic 63.2% |
| Cheyenne | 0.5 /100 | #263 | Tragic 63.2% |
| Kenyans | 0.5 /100 | #264 | Tragic 63.2% |
| Colville | 0.5 /100 | #265 | Tragic 63.2% |
| Immigrants | Western Africa | 0.5 /100 | #266 | Tragic 63.1% |
| Israelis | 0.4 /100 | #267 | Tragic 63.1% |
| Immigrants | Singapore | 0.4 /100 | #268 | Tragic 63.1% |
| Yugoslavians | 0.4 /100 | #269 | Tragic 63.1% |
| Immigrants | Austria | 0.3 /100 | #270 | Tragic 63.1% |
| Immigrants | Croatia | 0.3 /100 | #271 | Tragic 63.1% |
| Immigrants | Turkey | 0.3 /100 | #272 | Tragic 63.1% |
| Immigrants | Kazakhstan | 0.3 /100 | #273 | Tragic 63.1% |
| Lumbee | 0.3 /100 | #274 | Tragic 63.1% |
| West Indians | 0.3 /100 | #275 | Tragic 63.1% |