Dominican vs Immigrants from India Single Father Poverty
COMPARE
Dominican
Immigrants from India
Single Father Poverty
Single Father Poverty Comparison
Dominicans
Immigrants from India
19.1%
SINGLE FATHER POVERTY
0.0/ 100
METRIC RATING
317th/ 347
METRIC RANK
14.0%
SINGLE FATHER POVERTY
100.0/ 100
METRIC RATING
12th/ 347
METRIC RANK
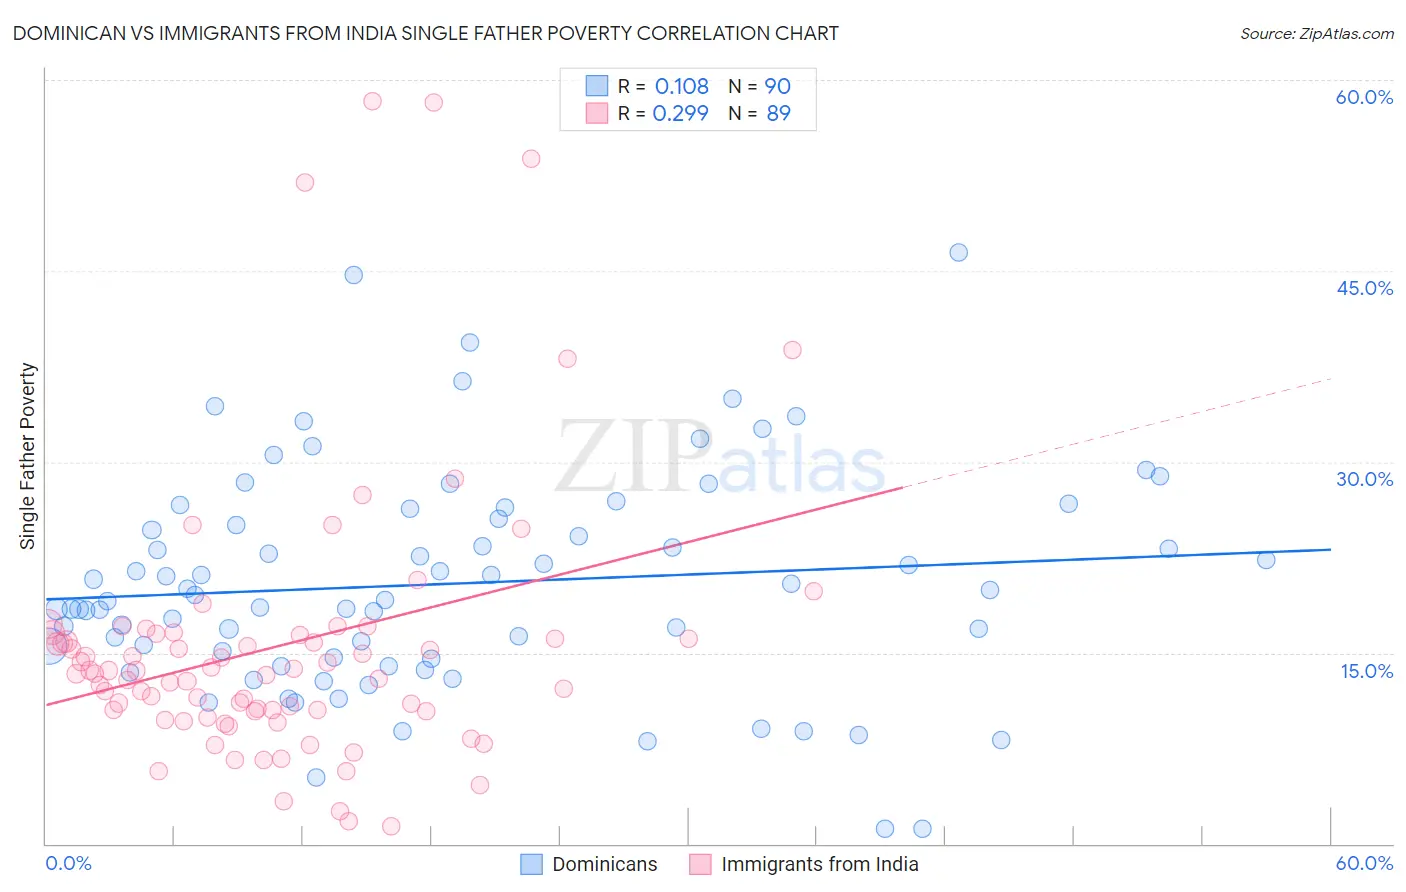
Dominican vs Immigrants from India Single Father Poverty Correlation Chart
The statistical analysis conducted on geographies consisting of 286,118,760 people shows a poor positive correlation between the proportion of Dominicans and poverty level among single fathers in the United States with a correlation coefficient (R) of 0.108 and weighted average of 19.1%. Similarly, the statistical analysis conducted on geographies consisting of 333,180,346 people shows a weak positive correlation between the proportion of Immigrants from India and poverty level among single fathers in the United States with a correlation coefficient (R) of 0.299 and weighted average of 14.0%, a difference of 36.1%.
Single Father Poverty Correlation Summary
| Measurement | Dominican | Immigrants from India |
| Minimum | 1.2% | 1.4% |
| Maximum | 46.5% | 58.3% |
| Range | 45.2% | 56.9% |
| Mean | 20.4% | 15.5% |
| Median | 19.4% | 13.3% |
| Interquartile 25% (IQ1) | 14.6% | 10.4% |
| Interquartile 75% (IQ3) | 25.5% | 16.5% |
| Interquartile Range (IQR) | 10.9% | 6.0% |
| Standard Deviation (Sample) | 8.6% | 10.8% |
| Standard Deviation (Population) | 8.6% | 10.8% |
Similar Demographics by Single Father Poverty
Demographics Similar to Dominicans by Single Father Poverty
In terms of single father poverty, the demographic groups most similar to Dominicans are Osage (19.0%, a difference of 0.31%), Dutch West Indian (19.2%, a difference of 0.58%), Chickasaw (19.0%, a difference of 0.71%), Delaware (18.9%, a difference of 0.87%), and Potawatomi (18.9%, a difference of 1.0%).
| Demographics | Rating | Rank | Single Father Poverty |
| Chippewa | 0.0 /100 | #310 | Tragic 18.8% |
| Immigrants | Nonimmigrants | 0.0 /100 | #311 | Tragic 18.8% |
| Immigrants | Dominica | 0.0 /100 | #312 | Tragic 18.9% |
| Potawatomi | 0.0 /100 | #313 | Tragic 18.9% |
| Delaware | 0.0 /100 | #314 | Tragic 18.9% |
| Chickasaw | 0.0 /100 | #315 | Tragic 19.0% |
| Osage | 0.0 /100 | #316 | Tragic 19.0% |
| Dominicans | 0.0 /100 | #317 | Tragic 19.1% |
| Dutch West Indians | 0.0 /100 | #318 | Tragic 19.2% |
| Slovaks | 0.0 /100 | #319 | Tragic 19.3% |
| Inupiat | 0.0 /100 | #320 | Tragic 19.5% |
| Cherokee | 0.0 /100 | #321 | Tragic 19.6% |
| Creek | 0.0 /100 | #322 | Tragic 19.8% |
| Pennsylvania Germans | 0.0 /100 | #323 | Tragic 20.0% |
| Americans | 0.0 /100 | #324 | Tragic 20.1% |
Demographics Similar to Immigrants from India by Single Father Poverty
In terms of single father poverty, the demographic groups most similar to Immigrants from India are Filipino (14.0%, a difference of 0.0%), Immigrants from Philippines (14.0%, a difference of 0.15%), Korean (14.0%, a difference of 0.41%), Afghan (14.0%, a difference of 0.51%), and Immigrants from Vietnam (14.1%, a difference of 0.85%).
| Demographics | Rating | Rank | Single Father Poverty |
| Immigrants | Ethiopia | 100.0 /100 | #5 | Exceptional 13.4% |
| Ethiopians | 100.0 /100 | #6 | Exceptional 13.5% |
| Immigrants | Taiwan | 100.0 /100 | #7 | Exceptional 13.7% |
| Samoans | 100.0 /100 | #8 | Exceptional 13.8% |
| Afghans | 100.0 /100 | #9 | Exceptional 14.0% |
| Koreans | 100.0 /100 | #10 | Exceptional 14.0% |
| Filipinos | 100.0 /100 | #11 | Exceptional 14.0% |
| Immigrants | India | 100.0 /100 | #12 | Exceptional 14.0% |
| Immigrants | Philippines | 100.0 /100 | #13 | Exceptional 14.0% |
| Immigrants | Vietnam | 100.0 /100 | #14 | Exceptional 14.1% |
| Sri Lankans | 100.0 /100 | #15 | Exceptional 14.2% |
| Immigrants | Iran | 100.0 /100 | #16 | Exceptional 14.2% |
| Immigrants | Hong Kong | 100.0 /100 | #17 | Exceptional 14.2% |
| Soviet Union | 100.0 /100 | #18 | Exceptional 14.3% |
| Immigrants | Iraq | 100.0 /100 | #19 | Exceptional 14.3% |