Dominican vs Immigrants from India 10th Grade
COMPARE
Dominican
Immigrants from India
10th Grade
10th Grade Comparison
Dominicans
Immigrants from India
89.4%
10TH GRADE
0.0/ 100
METRIC RATING
329th/ 347
METRIC RANK
95.3%
10TH GRADE
99.9/ 100
METRIC RATING
36th/ 347
METRIC RANK
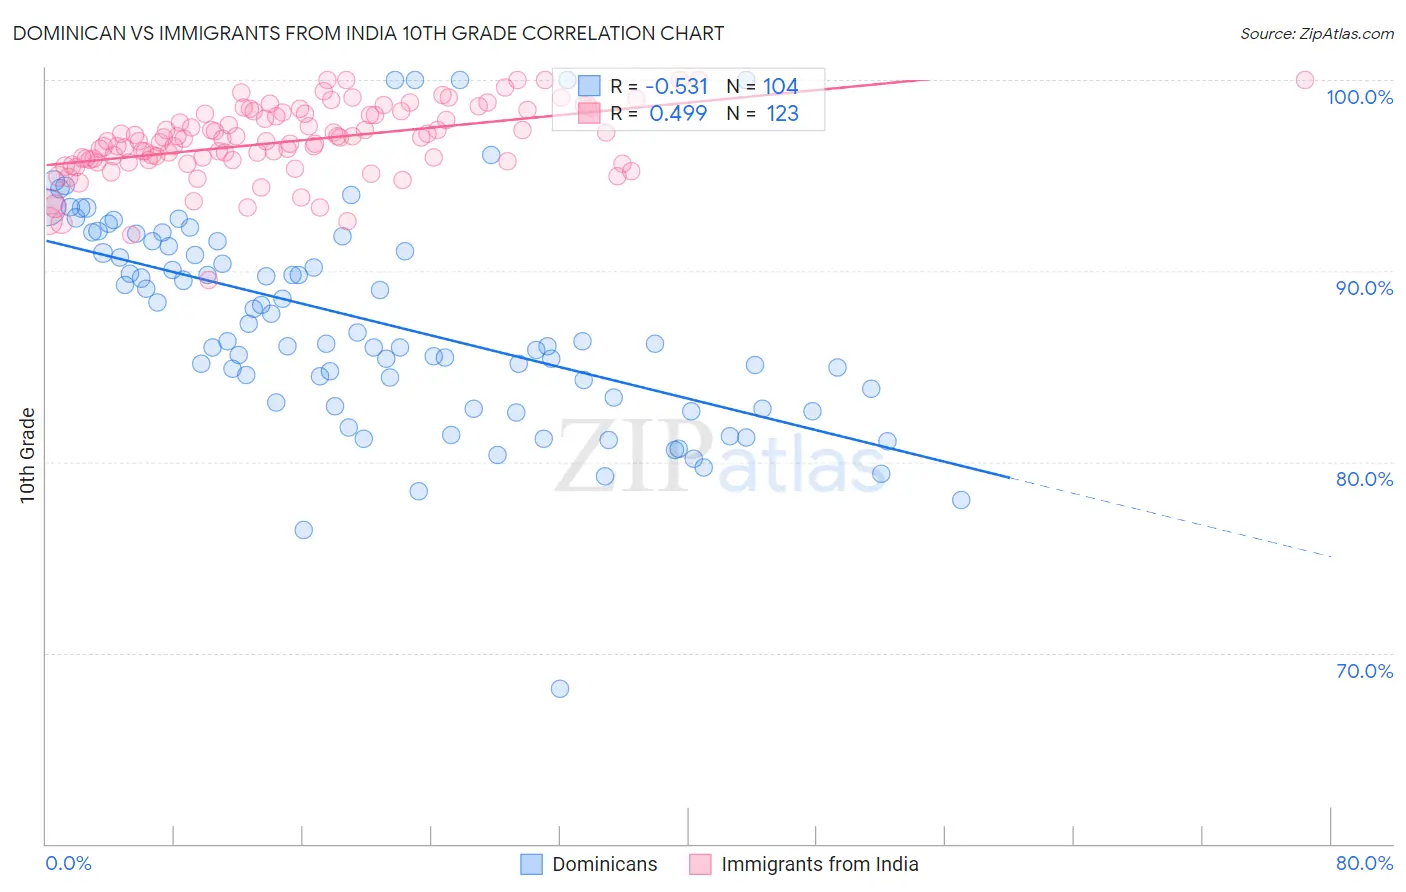
Dominican vs Immigrants from India 10th Grade Correlation Chart
The statistical analysis conducted on geographies consisting of 355,142,452 people shows a substantial negative correlation between the proportion of Dominicans and percentage of population with at least 10th grade education in the United States with a correlation coefficient (R) of -0.531 and weighted average of 89.4%. Similarly, the statistical analysis conducted on geographies consisting of 434,105,844 people shows a moderate positive correlation between the proportion of Immigrants from India and percentage of population with at least 10th grade education in the United States with a correlation coefficient (R) of 0.499 and weighted average of 95.3%, a difference of 6.7%.
10th Grade Correlation Summary
| Measurement | Dominican | Immigrants from India |
| Minimum | 68.1% | 89.5% |
| Maximum | 100.0% | 100.0% |
| Range | 31.9% | 10.5% |
| Mean | 87.3% | 96.8% |
| Median | 86.3% | 96.9% |
| Interquartile 25% (IQ1) | 83.2% | 95.8% |
| Interquartile 75% (IQ3) | 91.4% | 98.3% |
| Interquartile Range (IQR) | 8.2% | 2.5% |
| Standard Deviation (Sample) | 5.6% | 1.9% |
| Standard Deviation (Population) | 5.6% | 1.9% |
Similar Demographics by 10th Grade
Demographics Similar to Dominicans by 10th Grade
In terms of 10th grade, the demographic groups most similar to Dominicans are Immigrants from Cabo Verde (89.5%, a difference of 0.10%), Immigrants from Nicaragua (89.5%, a difference of 0.11%), Immigrants from Yemen (89.1%, a difference of 0.35%), Central American Indian (89.7%, a difference of 0.37%), and Mexican American Indian (89.0%, a difference of 0.38%).
| Demographics | Rating | Rank | 10th Grade |
| Tohono O'odham | 0.0 /100 | #322 | Tragic 90.1% |
| Immigrants | Belize | 0.0 /100 | #323 | Tragic 90.1% |
| Immigrants | Armenia | 0.0 /100 | #324 | Tragic 89.9% |
| Puerto Ricans | 0.0 /100 | #325 | Tragic 89.8% |
| Central American Indians | 0.0 /100 | #326 | Tragic 89.7% |
| Immigrants | Nicaragua | 0.0 /100 | #327 | Tragic 89.5% |
| Immigrants | Cabo Verde | 0.0 /100 | #328 | Tragic 89.5% |
| Dominicans | 0.0 /100 | #329 | Tragic 89.4% |
| Immigrants | Yemen | 0.0 /100 | #330 | Tragic 89.1% |
| Mexican American Indians | 0.0 /100 | #331 | Tragic 89.0% |
| Immigrants | Azores | 0.0 /100 | #332 | Tragic 89.0% |
| Hondurans | 0.0 /100 | #333 | Tragic 89.0% |
| Hispanics or Latinos | 0.0 /100 | #334 | Tragic 88.9% |
| Immigrants | Dominican Republic | 0.0 /100 | #335 | Tragic 88.7% |
| Immigrants | Honduras | 0.0 /100 | #336 | Tragic 88.5% |
Demographics Similar to Immigrants from India by 10th Grade
In terms of 10th grade, the demographic groups most similar to Immigrants from India are Estonian (95.3%, a difference of 0.010%), Hungarian (95.3%, a difference of 0.020%), French (95.3%, a difference of 0.020%), British (95.3%, a difference of 0.020%), and French Canadian (95.3%, a difference of 0.020%).
| Demographics | Rating | Rank | 10th Grade |
| Bulgarians | 100.0 /100 | #29 | Exceptional 95.4% |
| Belgians | 100.0 /100 | #30 | Exceptional 95.4% |
| Iranians | 100.0 /100 | #31 | Exceptional 95.3% |
| Hungarians | 100.0 /100 | #32 | Exceptional 95.3% |
| French | 100.0 /100 | #33 | Exceptional 95.3% |
| British | 99.9 /100 | #34 | Exceptional 95.3% |
| Estonians | 99.9 /100 | #35 | Exceptional 95.3% |
| Immigrants | India | 99.9 /100 | #36 | Exceptional 95.3% |
| French Canadians | 99.9 /100 | #37 | Exceptional 95.3% |
| Northern Europeans | 99.9 /100 | #38 | Exceptional 95.3% |
| Immigrants | Scotland | 99.9 /100 | #39 | Exceptional 95.2% |
| Scotch-Irish | 99.9 /100 | #40 | Exceptional 95.2% |
| Russians | 99.9 /100 | #41 | Exceptional 95.2% |
| Slavs | 99.9 /100 | #42 | Exceptional 95.2% |
| Macedonians | 99.9 /100 | #43 | Exceptional 95.2% |