Immigrants from Taiwan vs Immigrants from India Single Father Poverty
COMPARE
Immigrants from Taiwan
Immigrants from India
Single Father Poverty
Single Father Poverty Comparison
Immigrants from Taiwan
Immigrants from India
13.7%
SINGLE FATHER POVERTY
100.0/ 100
METRIC RATING
7th/ 347
METRIC RANK
14.0%
SINGLE FATHER POVERTY
100.0/ 100
METRIC RATING
12th/ 347
METRIC RANK
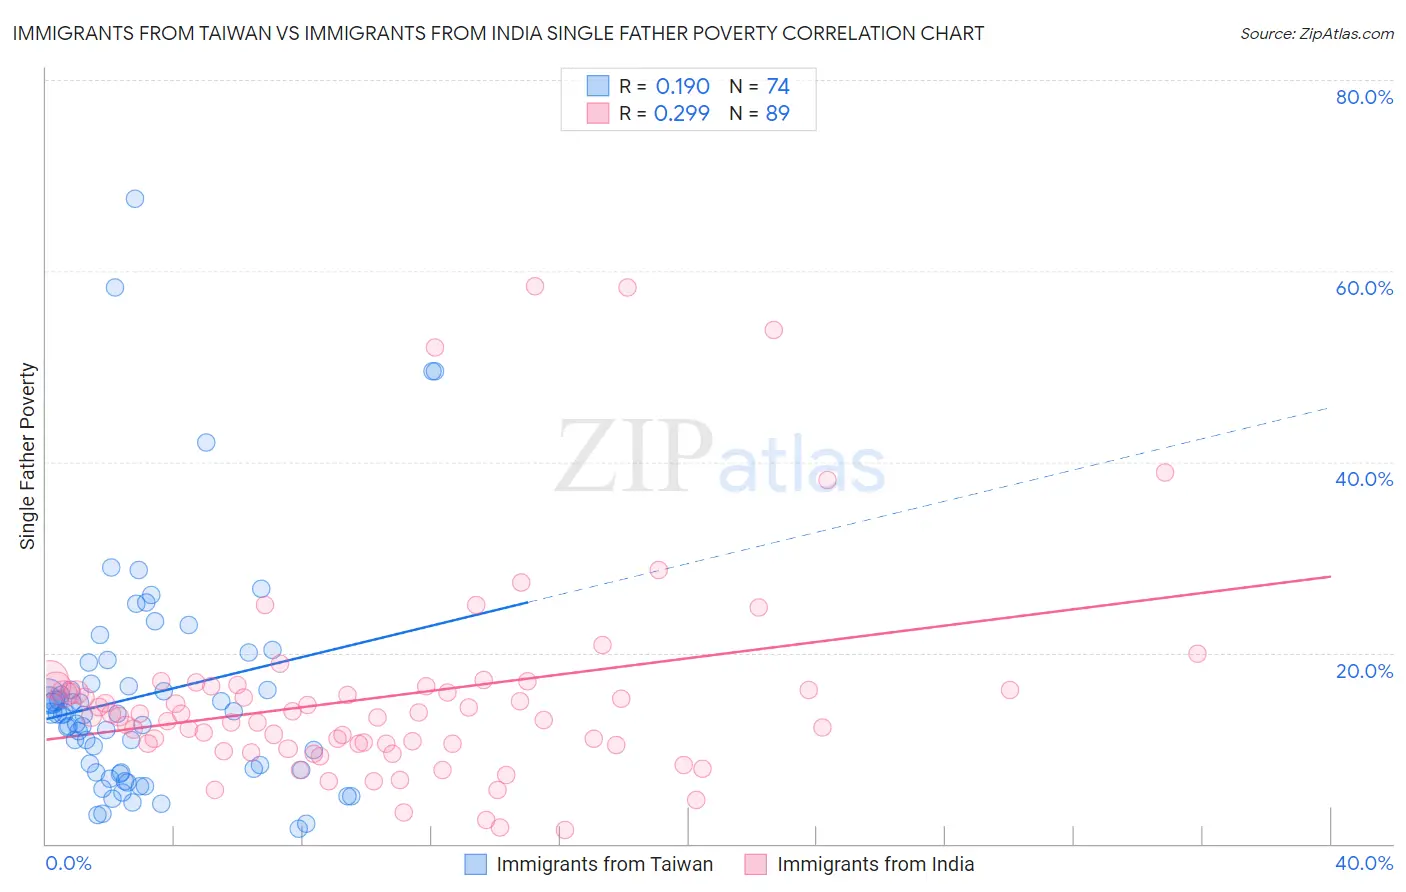
Immigrants from Taiwan vs Immigrants from India Single Father Poverty Correlation Chart
The statistical analysis conducted on geographies consisting of 238,751,795 people shows a poor positive correlation between the proportion of Immigrants from Taiwan and poverty level among single fathers in the United States with a correlation coefficient (R) of 0.190 and weighted average of 13.7%. Similarly, the statistical analysis conducted on geographies consisting of 333,180,346 people shows a weak positive correlation between the proportion of Immigrants from India and poverty level among single fathers in the United States with a correlation coefficient (R) of 0.299 and weighted average of 14.0%, a difference of 2.5%.
Single Father Poverty Correlation Summary
| Measurement | Immigrants from Taiwan | Immigrants from India |
| Minimum | 1.5% | 1.4% |
| Maximum | 67.6% | 58.3% |
| Range | 66.0% | 56.9% |
| Mean | 15.6% | 15.5% |
| Median | 13.6% | 13.3% |
| Interquartile 25% (IQ1) | 7.5% | 10.4% |
| Interquartile 75% (IQ3) | 16.8% | 16.5% |
| Interquartile Range (IQR) | 9.3% | 6.0% |
| Standard Deviation (Sample) | 12.3% | 10.8% |
| Standard Deviation (Population) | 12.2% | 10.8% |
Demographics Similar to Immigrants from Taiwan and Immigrants from India by Single Father Poverty
In terms of single father poverty, the demographic groups most similar to Immigrants from Taiwan are Samoan (13.8%, a difference of 0.86%), Ethiopian (13.5%, a difference of 1.1%), Immigrants from Ethiopia (13.4%, a difference of 1.8%), Afghan (14.0%, a difference of 2.0%), and Korean (14.0%, a difference of 2.1%). Similarly, the demographic groups most similar to Immigrants from India are Filipino (14.0%, a difference of 0.0%), Immigrants from Philippines (14.0%, a difference of 0.15%), Korean (14.0%, a difference of 0.41%), Afghan (14.0%, a difference of 0.51%), and Immigrants from Vietnam (14.1%, a difference of 0.85%).
| Demographics | Rating | Rank | Single Father Poverty |
| Assyrians/Chaldeans/Syriacs | 100.0 /100 | #1 | Exceptional 11.7% |
| Tongans | 100.0 /100 | #2 | Exceptional 12.2% |
| Tsimshian | 100.0 /100 | #3 | Exceptional 12.7% |
| Immigrants | Fiji | 100.0 /100 | #4 | Exceptional 13.2% |
| Immigrants | Ethiopia | 100.0 /100 | #5 | Exceptional 13.4% |
| Ethiopians | 100.0 /100 | #6 | Exceptional 13.5% |
| Immigrants | Taiwan | 100.0 /100 | #7 | Exceptional 13.7% |
| Samoans | 100.0 /100 | #8 | Exceptional 13.8% |
| Afghans | 100.0 /100 | #9 | Exceptional 14.0% |
| Koreans | 100.0 /100 | #10 | Exceptional 14.0% |
| Filipinos | 100.0 /100 | #11 | Exceptional 14.0% |
| Immigrants | India | 100.0 /100 | #12 | Exceptional 14.0% |
| Immigrants | Philippines | 100.0 /100 | #13 | Exceptional 14.0% |
| Immigrants | Vietnam | 100.0 /100 | #14 | Exceptional 14.1% |
| Sri Lankans | 100.0 /100 | #15 | Exceptional 14.2% |
| Immigrants | Iran | 100.0 /100 | #16 | Exceptional 14.2% |
| Immigrants | Hong Kong | 100.0 /100 | #17 | Exceptional 14.2% |
| Soviet Union | 100.0 /100 | #18 | Exceptional 14.3% |
| Immigrants | Iraq | 100.0 /100 | #19 | Exceptional 14.3% |
| Immigrants | Singapore | 100.0 /100 | #20 | Exceptional 14.3% |