Dominican vs Immigrants from Belize Single Father Poverty
COMPARE
Dominican
Immigrants from Belize
Single Father Poverty
Single Father Poverty Comparison
Dominicans
Immigrants from Belize
19.1%
SINGLE FATHER POVERTY
0.0/ 100
METRIC RATING
317th/ 347
METRIC RANK
16.5%
SINGLE FATHER POVERTY
19.8/ 100
METRIC RATING
199th/ 347
METRIC RANK
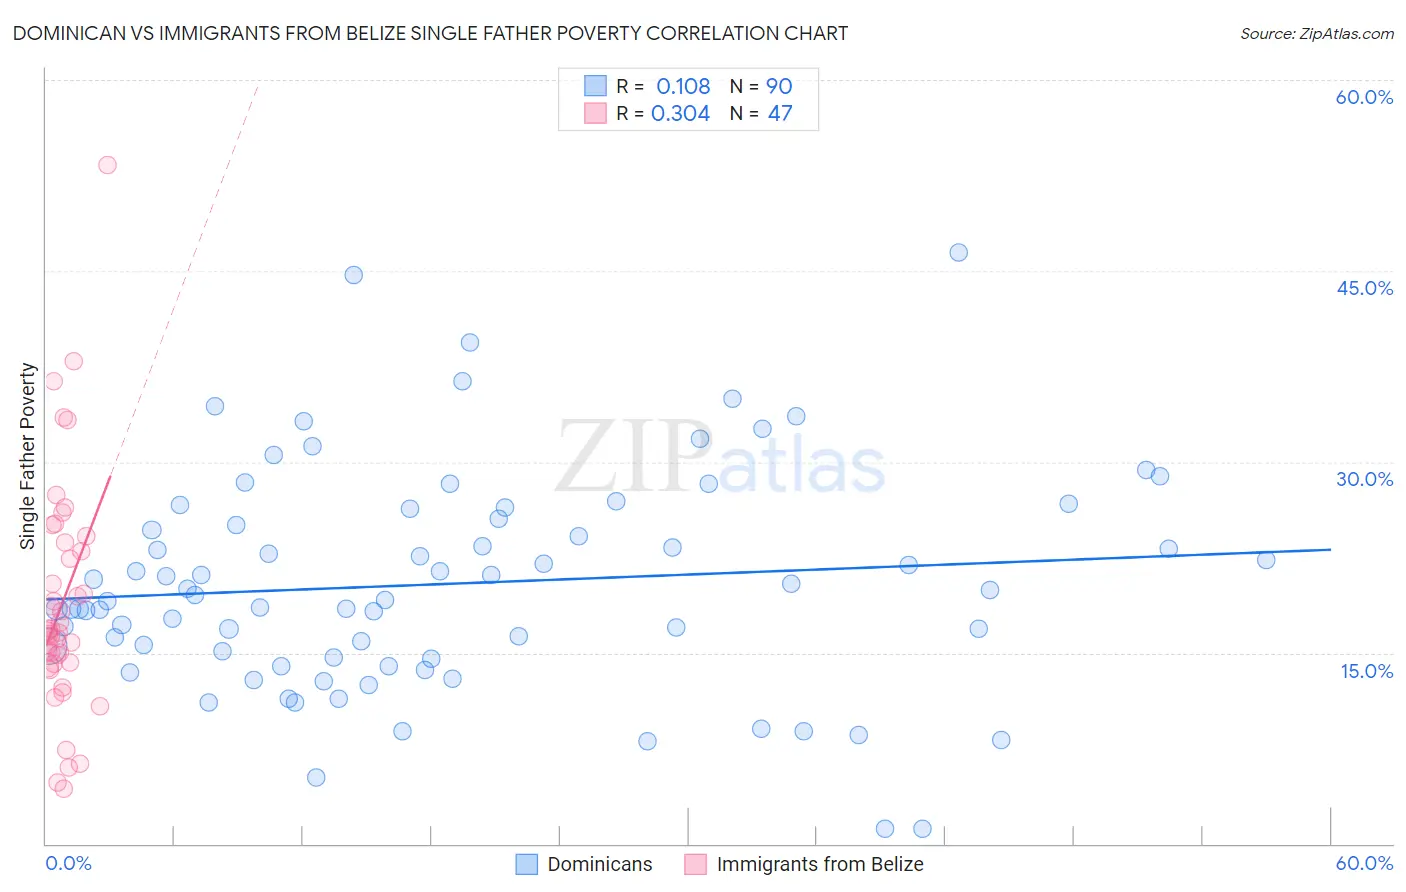
Dominican vs Immigrants from Belize Single Father Poverty Correlation Chart
The statistical analysis conducted on geographies consisting of 286,118,760 people shows a poor positive correlation between the proportion of Dominicans and poverty level among single fathers in the United States with a correlation coefficient (R) of 0.108 and weighted average of 19.1%. Similarly, the statistical analysis conducted on geographies consisting of 118,811,167 people shows a mild positive correlation between the proportion of Immigrants from Belize and poverty level among single fathers in the United States with a correlation coefficient (R) of 0.304 and weighted average of 16.5%, a difference of 15.4%.
Single Father Poverty Correlation Summary
| Measurement | Dominican | Immigrants from Belize |
| Minimum | 1.2% | 4.3% |
| Maximum | 46.5% | 53.3% |
| Range | 45.2% | 49.0% |
| Mean | 20.4% | 18.9% |
| Median | 19.4% | 16.7% |
| Interquartile 25% (IQ1) | 14.6% | 14.1% |
| Interquartile 75% (IQ3) | 25.5% | 23.7% |
| Interquartile Range (IQR) | 10.9% | 9.6% |
| Standard Deviation (Sample) | 8.6% | 9.2% |
| Standard Deviation (Population) | 8.6% | 9.1% |
Similar Demographics by Single Father Poverty
Demographics Similar to Dominicans by Single Father Poverty
In terms of single father poverty, the demographic groups most similar to Dominicans are Osage (19.0%, a difference of 0.31%), Dutch West Indian (19.2%, a difference of 0.58%), Chickasaw (19.0%, a difference of 0.71%), Delaware (18.9%, a difference of 0.87%), and Potawatomi (18.9%, a difference of 1.0%).
| Demographics | Rating | Rank | Single Father Poverty |
| Chippewa | 0.0 /100 | #310 | Tragic 18.8% |
| Immigrants | Nonimmigrants | 0.0 /100 | #311 | Tragic 18.8% |
| Immigrants | Dominica | 0.0 /100 | #312 | Tragic 18.9% |
| Potawatomi | 0.0 /100 | #313 | Tragic 18.9% |
| Delaware | 0.0 /100 | #314 | Tragic 18.9% |
| Chickasaw | 0.0 /100 | #315 | Tragic 19.0% |
| Osage | 0.0 /100 | #316 | Tragic 19.0% |
| Dominicans | 0.0 /100 | #317 | Tragic 19.1% |
| Dutch West Indians | 0.0 /100 | #318 | Tragic 19.2% |
| Slovaks | 0.0 /100 | #319 | Tragic 19.3% |
| Inupiat | 0.0 /100 | #320 | Tragic 19.5% |
| Cherokee | 0.0 /100 | #321 | Tragic 19.6% |
| Creek | 0.0 /100 | #322 | Tragic 19.8% |
| Pennsylvania Germans | 0.0 /100 | #323 | Tragic 20.0% |
| Americans | 0.0 /100 | #324 | Tragic 20.1% |
Demographics Similar to Immigrants from Belize by Single Father Poverty
In terms of single father poverty, the demographic groups most similar to Immigrants from Belize are Romanian (16.5%, a difference of 0.020%), Immigrants from Northern Europe (16.5%, a difference of 0.030%), Immigrants from Canada (16.5%, a difference of 0.14%), Syrian (16.6%, a difference of 0.17%), and Cuban (16.6%, a difference of 0.24%).
| Demographics | Rating | Rank | Single Father Poverty |
| Immigrants | Switzerland | 24.8 /100 | #192 | Fair 16.5% |
| Ecuadorians | 24.5 /100 | #193 | Fair 16.5% |
| Cape Verdeans | 24.4 /100 | #194 | Fair 16.5% |
| Immigrants | Barbados | 24.3 /100 | #195 | Fair 16.5% |
| Immigrants | Canada | 21.9 /100 | #196 | Fair 16.5% |
| Immigrants | Northern Europe | 20.3 /100 | #197 | Fair 16.5% |
| Romanians | 20.1 /100 | #198 | Fair 16.5% |
| Immigrants | Belize | 19.8 /100 | #199 | Poor 16.5% |
| Syrians | 17.4 /100 | #200 | Poor 16.6% |
| Cubans | 16.5 /100 | #201 | Poor 16.6% |
| Immigrants | Croatia | 16.5 /100 | #202 | Poor 16.6% |
| Immigrants | North America | 15.1 /100 | #203 | Poor 16.6% |
| Immigrants | Guatemala | 14.8 /100 | #204 | Poor 16.6% |
| Venezuelans | 14.3 /100 | #205 | Poor 16.6% |
| Immigrants | Senegal | 13.7 /100 | #206 | Poor 16.6% |