Dominican vs Immigrants from Saudi Arabia Single Father Poverty
COMPARE
Dominican
Immigrants from Saudi Arabia
Single Father Poverty
Single Father Poverty Comparison
Dominicans
Immigrants from Saudi Arabia
19.1%
SINGLE FATHER POVERTY
0.0/ 100
METRIC RATING
317th/ 347
METRIC RANK
16.9%
SINGLE FATHER POVERTY
2.7/ 100
METRIC RATING
238th/ 347
METRIC RANK
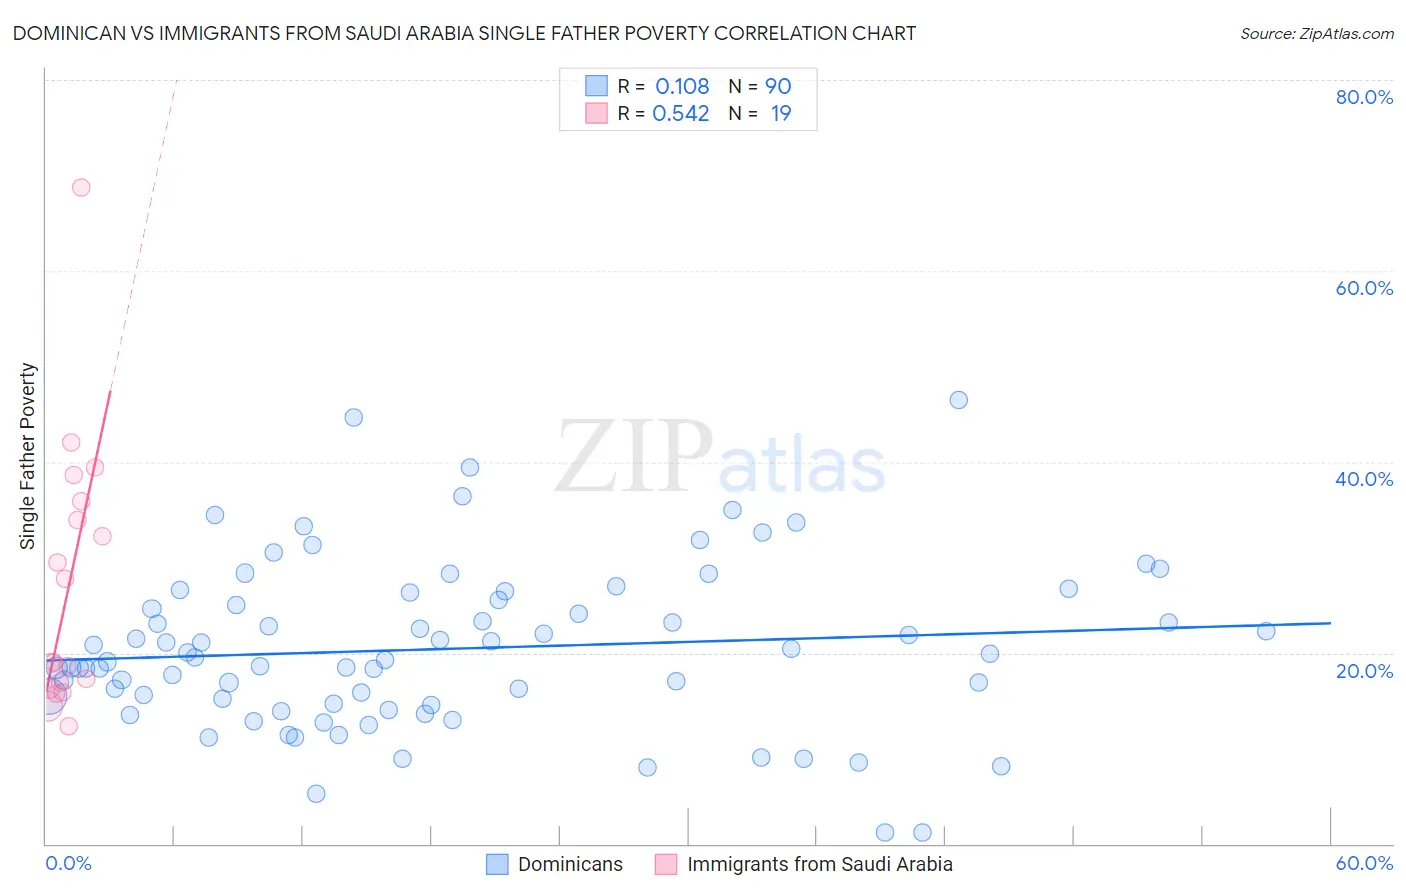
Dominican vs Immigrants from Saudi Arabia Single Father Poverty Correlation Chart
The statistical analysis conducted on geographies consisting of 286,118,760 people shows a poor positive correlation between the proportion of Dominicans and poverty level among single fathers in the United States with a correlation coefficient (R) of 0.108 and weighted average of 19.1%. Similarly, the statistical analysis conducted on geographies consisting of 144,012,732 people shows a substantial positive correlation between the proportion of Immigrants from Saudi Arabia and poverty level among single fathers in the United States with a correlation coefficient (R) of 0.542 and weighted average of 16.9%, a difference of 12.7%.
Single Father Poverty Correlation Summary
| Measurement | Dominican | Immigrants from Saudi Arabia |
| Minimum | 1.2% | 12.3% |
| Maximum | 46.5% | 68.8% |
| Range | 45.2% | 56.4% |
| Mean | 20.4% | 27.0% |
| Median | 19.4% | 19.0% |
| Interquartile 25% (IQ1) | 14.6% | 16.2% |
| Interquartile 75% (IQ3) | 25.5% | 35.9% |
| Interquartile Range (IQR) | 10.9% | 19.7% |
| Standard Deviation (Sample) | 8.6% | 14.1% |
| Standard Deviation (Population) | 8.6% | 13.7% |
Similar Demographics by Single Father Poverty
Demographics Similar to Dominicans by Single Father Poverty
In terms of single father poverty, the demographic groups most similar to Dominicans are Osage (19.0%, a difference of 0.31%), Dutch West Indian (19.2%, a difference of 0.58%), Chickasaw (19.0%, a difference of 0.71%), Delaware (18.9%, a difference of 0.87%), and Potawatomi (18.9%, a difference of 1.0%).
| Demographics | Rating | Rank | Single Father Poverty |
| Chippewa | 0.0 /100 | #310 | Tragic 18.8% |
| Immigrants | Nonimmigrants | 0.0 /100 | #311 | Tragic 18.8% |
| Immigrants | Dominica | 0.0 /100 | #312 | Tragic 18.9% |
| Potawatomi | 0.0 /100 | #313 | Tragic 18.9% |
| Delaware | 0.0 /100 | #314 | Tragic 18.9% |
| Chickasaw | 0.0 /100 | #315 | Tragic 19.0% |
| Osage | 0.0 /100 | #316 | Tragic 19.0% |
| Dominicans | 0.0 /100 | #317 | Tragic 19.1% |
| Dutch West Indians | 0.0 /100 | #318 | Tragic 19.2% |
| Slovaks | 0.0 /100 | #319 | Tragic 19.3% |
| Inupiat | 0.0 /100 | #320 | Tragic 19.5% |
| Cherokee | 0.0 /100 | #321 | Tragic 19.6% |
| Creek | 0.0 /100 | #322 | Tragic 19.8% |
| Pennsylvania Germans | 0.0 /100 | #323 | Tragic 20.0% |
| Americans | 0.0 /100 | #324 | Tragic 20.1% |
Demographics Similar to Immigrants from Saudi Arabia by Single Father Poverty
In terms of single father poverty, the demographic groups most similar to Immigrants from Saudi Arabia are Bermudan (16.9%, a difference of 0.020%), Finnish (16.9%, a difference of 0.030%), Immigrants from Western Europe (16.9%, a difference of 0.070%), Immigrants from Germany (16.9%, a difference of 0.070%), and Subsaharan African (16.9%, a difference of 0.070%).
| Demographics | Rating | Rank | Single Father Poverty |
| Spanish Americans | 3.7 /100 | #231 | Tragic 16.9% |
| Immigrants | Grenada | 3.7 /100 | #232 | Tragic 16.9% |
| Senegalese | 3.2 /100 | #233 | Tragic 16.9% |
| Marshallese | 3.1 /100 | #234 | Tragic 16.9% |
| Immigrants | Western Europe | 2.9 /100 | #235 | Tragic 16.9% |
| Immigrants | Germany | 2.9 /100 | #236 | Tragic 16.9% |
| Sub-Saharan Africans | 2.9 /100 | #237 | Tragic 16.9% |
| Immigrants | Saudi Arabia | 2.7 /100 | #238 | Tragic 16.9% |
| Bermudans | 2.6 /100 | #239 | Tragic 16.9% |
| Finns | 2.6 /100 | #240 | Tragic 16.9% |
| Czechs | 2.3 /100 | #241 | Tragic 17.0% |
| Moroccans | 2.1 /100 | #242 | Tragic 17.0% |
| Immigrants | Cabo Verde | 1.6 /100 | #243 | Tragic 17.0% |
| Hondurans | 1.6 /100 | #244 | Tragic 17.0% |
| Trinidadians and Tobagonians | 1.5 /100 | #245 | Tragic 17.0% |