Dominican vs Immigrants from Belgium Single Father Poverty
COMPARE
Dominican
Immigrants from Belgium
Single Father Poverty
Single Father Poverty Comparison
Dominicans
Immigrants from Belgium
19.1%
SINGLE FATHER POVERTY
0.0/ 100
METRIC RATING
317th/ 347
METRIC RANK
15.6%
SINGLE FATHER POVERTY
98.1/ 100
METRIC RATING
96th/ 347
METRIC RANK
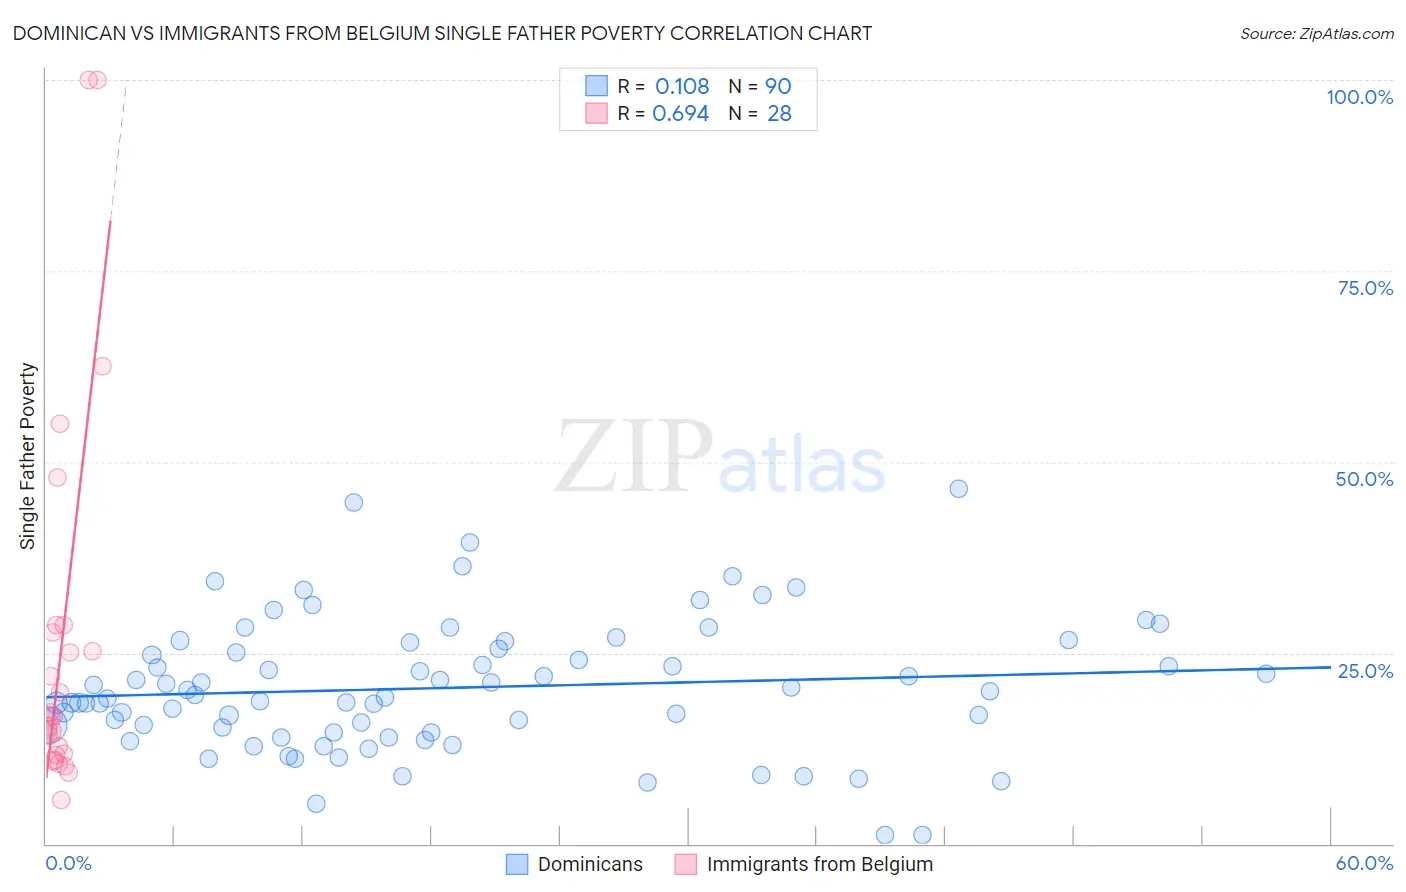
Dominican vs Immigrants from Belgium Single Father Poverty Correlation Chart
The statistical analysis conducted on geographies consisting of 286,118,760 people shows a poor positive correlation between the proportion of Dominicans and poverty level among single fathers in the United States with a correlation coefficient (R) of 0.108 and weighted average of 19.1%. Similarly, the statistical analysis conducted on geographies consisting of 126,136,334 people shows a significant positive correlation between the proportion of Immigrants from Belgium and poverty level among single fathers in the United States with a correlation coefficient (R) of 0.694 and weighted average of 15.6%, a difference of 22.5%.
Single Father Poverty Correlation Summary
| Measurement | Dominican | Immigrants from Belgium |
| Minimum | 1.2% | 5.7% |
| Maximum | 46.5% | 100.0% |
| Range | 45.2% | 94.3% |
| Mean | 20.4% | 26.6% |
| Median | 19.4% | 16.7% |
| Interquartile 25% (IQ1) | 14.6% | 11.7% |
| Interquartile 75% (IQ3) | 25.5% | 28.1% |
| Interquartile Range (IQR) | 10.9% | 16.4% |
| Standard Deviation (Sample) | 8.6% | 24.8% |
| Standard Deviation (Population) | 8.6% | 24.4% |
Similar Demographics by Single Father Poverty
Demographics Similar to Dominicans by Single Father Poverty
In terms of single father poverty, the demographic groups most similar to Dominicans are Osage (19.0%, a difference of 0.31%), Dutch West Indian (19.2%, a difference of 0.58%), Chickasaw (19.0%, a difference of 0.71%), Delaware (18.9%, a difference of 0.87%), and Potawatomi (18.9%, a difference of 1.0%).
| Demographics | Rating | Rank | Single Father Poverty |
| Chippewa | 0.0 /100 | #310 | Tragic 18.8% |
| Immigrants | Nonimmigrants | 0.0 /100 | #311 | Tragic 18.8% |
| Immigrants | Dominica | 0.0 /100 | #312 | Tragic 18.9% |
| Potawatomi | 0.0 /100 | #313 | Tragic 18.9% |
| Delaware | 0.0 /100 | #314 | Tragic 18.9% |
| Chickasaw | 0.0 /100 | #315 | Tragic 19.0% |
| Osage | 0.0 /100 | #316 | Tragic 19.0% |
| Dominicans | 0.0 /100 | #317 | Tragic 19.1% |
| Dutch West Indians | 0.0 /100 | #318 | Tragic 19.2% |
| Slovaks | 0.0 /100 | #319 | Tragic 19.3% |
| Inupiat | 0.0 /100 | #320 | Tragic 19.5% |
| Cherokee | 0.0 /100 | #321 | Tragic 19.6% |
| Creek | 0.0 /100 | #322 | Tragic 19.8% |
| Pennsylvania Germans | 0.0 /100 | #323 | Tragic 20.0% |
| Americans | 0.0 /100 | #324 | Tragic 20.1% |
Demographics Similar to Immigrants from Belgium by Single Father Poverty
In terms of single father poverty, the demographic groups most similar to Immigrants from Belgium are Immigrants from Kazakhstan (15.6%, a difference of 0.010%), Yaqui (15.6%, a difference of 0.010%), Zimbabwean (15.6%, a difference of 0.020%), Immigrants from Uruguay (15.6%, a difference of 0.060%), and Basque (15.5%, a difference of 0.20%).
| Demographics | Rating | Rank | Single Father Poverty |
| Immigrants | Korea | 99.0 /100 | #89 | Exceptional 15.5% |
| Mexican American Indians | 98.7 /100 | #90 | Exceptional 15.5% |
| Immigrants | Romania | 98.6 /100 | #91 | Exceptional 15.5% |
| Immigrants | Serbia | 98.5 /100 | #92 | Exceptional 15.5% |
| Basques | 98.4 /100 | #93 | Exceptional 15.5% |
| Immigrants | Uruguay | 98.2 /100 | #94 | Exceptional 15.6% |
| Immigrants | Kazakhstan | 98.2 /100 | #95 | Exceptional 15.6% |
| Immigrants | Belgium | 98.1 /100 | #96 | Exceptional 15.6% |
| Yaqui | 98.1 /100 | #97 | Exceptional 15.6% |
| Zimbabweans | 98.1 /100 | #98 | Exceptional 15.6% |
| Immigrants | Middle Africa | 97.4 /100 | #99 | Exceptional 15.6% |
| Immigrants | Chile | 96.9 /100 | #100 | Exceptional 15.7% |
| Fijians | 96.8 /100 | #101 | Exceptional 15.7% |
| Chileans | 96.4 /100 | #102 | Exceptional 15.7% |
| South American Indians | 96.2 /100 | #103 | Exceptional 15.7% |