Danish vs Ukrainian Unemployment Among Women with Children Under 6 years
COMPARE
Danish
Ukrainian
Unemployment Among Women with Children Under 6 years
Unemployment Among Women with Children Under 6 years Comparison
Danes
Ukrainians
7.1%
UNEMPLOYMENT AMONG WOMEN WITH CHILDREN UNDER 6 YEARS
98.2/ 100
METRIC RATING
91st/ 347
METRIC RANK
7.4%
UNEMPLOYMENT AMONG WOMEN WITH CHILDREN UNDER 6 YEARS
88.2/ 100
METRIC RATING
131st/ 347
METRIC RANK
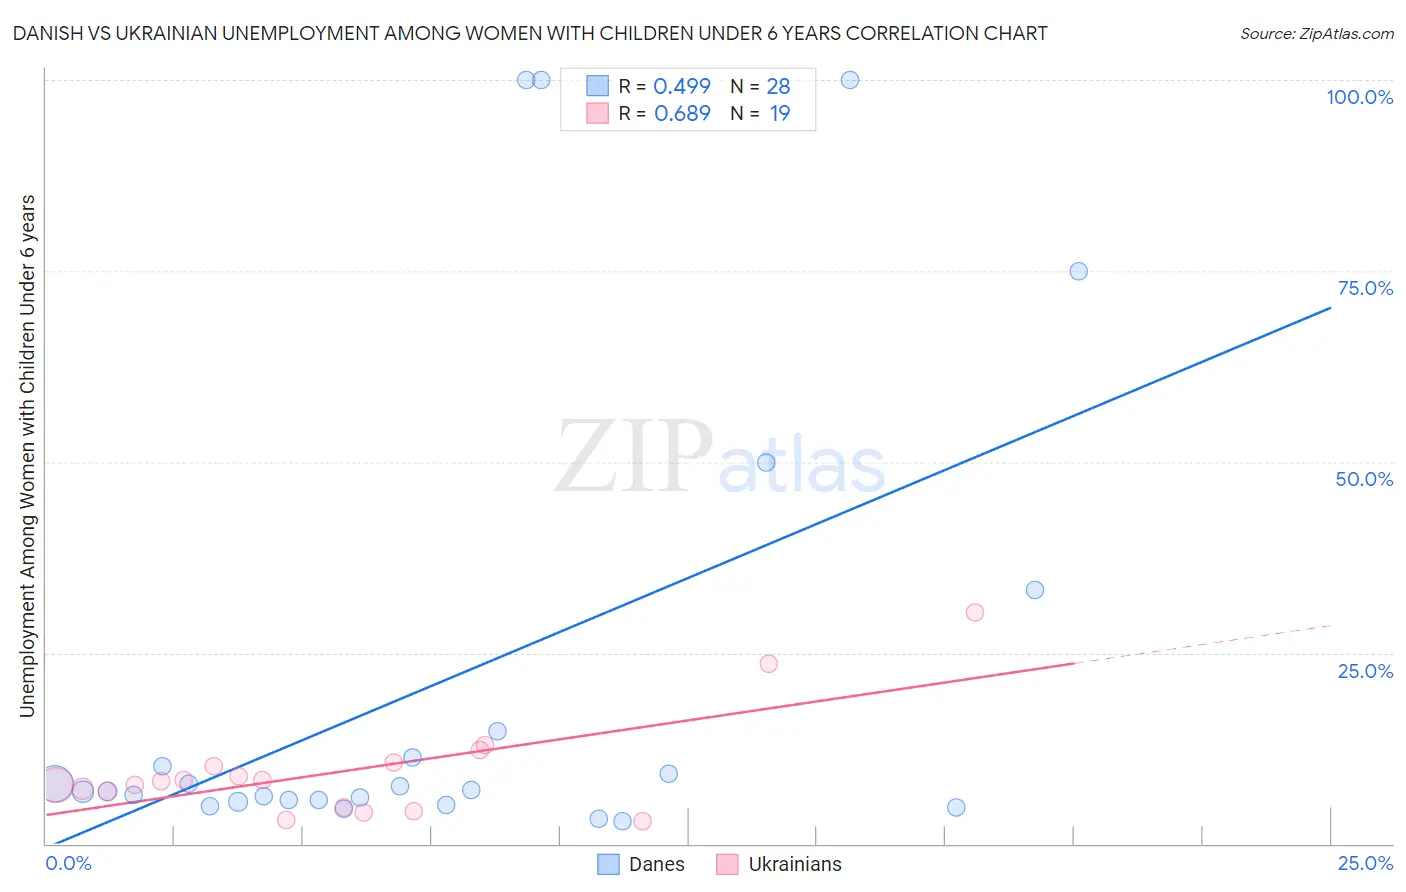
Danish vs Ukrainian Unemployment Among Women with Children Under 6 years Correlation Chart
The statistical analysis conducted on geographies consisting of 332,454,296 people shows a moderate positive correlation between the proportion of Danes and unemployment rate among women with children under the age of 6 in the United States with a correlation coefficient (R) of 0.499 and weighted average of 7.1%. Similarly, the statistical analysis conducted on geographies consisting of 322,354,784 people shows a significant positive correlation between the proportion of Ukrainians and unemployment rate among women with children under the age of 6 in the United States with a correlation coefficient (R) of 0.689 and weighted average of 7.4%, a difference of 3.5%.
Unemployment Among Women with Children Under 6 years Correlation Summary
| Measurement | Danish | Ukrainian |
| Minimum | 3.0% | 2.9% |
| Maximum | 100.0% | 30.2% |
| Range | 97.0% | 27.3% |
| Mean | 21.7% | 9.6% |
| Median | 6.9% | 8.2% |
| Interquartile 25% (IQ1) | 5.6% | 4.8% |
| Interquartile 75% (IQ3) | 13.0% | 10.6% |
| Interquartile Range (IQR) | 7.4% | 5.8% |
| Standard Deviation (Sample) | 31.7% | 6.8% |
| Standard Deviation (Population) | 31.2% | 6.6% |
Similar Demographics by Unemployment Among Women with Children Under 6 years
Demographics Similar to Danes by Unemployment Among Women with Children Under 6 years
In terms of unemployment among women with children under 6 years, the demographic groups most similar to Danes are Immigrants from Spain (7.1%, a difference of 0.060%), Immigrants from Denmark (7.1%, a difference of 0.12%), Albanian (7.2%, a difference of 0.14%), Immigrants from Hungary (7.1%, a difference of 0.16%), and Alsatian (7.1%, a difference of 0.28%).
| Demographics | Rating | Rank | Unemployment Among Women with Children Under 6 years |
| Immigrants | Albania | 98.7 /100 | #84 | Exceptional 7.1% |
| Immigrants | Romania | 98.7 /100 | #85 | Exceptional 7.1% |
| Immigrants | Zimbabwe | 98.6 /100 | #86 | Exceptional 7.1% |
| Alsatians | 98.4 /100 | #87 | Exceptional 7.1% |
| Immigrants | Hungary | 98.3 /100 | #88 | Exceptional 7.1% |
| Immigrants | Denmark | 98.3 /100 | #89 | Exceptional 7.1% |
| Immigrants | Spain | 98.2 /100 | #90 | Exceptional 7.1% |
| Danes | 98.2 /100 | #91 | Exceptional 7.1% |
| Albanians | 98.0 /100 | #92 | Exceptional 7.2% |
| New Zealanders | 97.8 /100 | #93 | Exceptional 7.2% |
| Macedonians | 97.7 /100 | #94 | Exceptional 7.2% |
| Romanians | 97.7 /100 | #95 | Exceptional 7.2% |
| Immigrants | Eastern Africa | 97.7 /100 | #96 | Exceptional 7.2% |
| Immigrants | South Eastern Asia | 97.6 /100 | #97 | Exceptional 7.2% |
| Russians | 97.5 /100 | #98 | Exceptional 7.2% |
Demographics Similar to Ukrainians by Unemployment Among Women with Children Under 6 years
In terms of unemployment among women with children under 6 years, the demographic groups most similar to Ukrainians are Swedish (7.4%, a difference of 0.040%), Immigrants from Armenia (7.4%, a difference of 0.13%), Slovene (7.4%, a difference of 0.17%), Immigrants from Uganda (7.4%, a difference of 0.25%), and Immigrants from Bolivia (7.4%, a difference of 0.37%).
| Demographics | Rating | Rank | Unemployment Among Women with Children Under 6 years |
| Immigrants | South Africa | 92.5 /100 | #124 | Exceptional 7.3% |
| Pakistanis | 92.2 /100 | #125 | Exceptional 7.3% |
| Immigrants | Burma/Myanmar | 91.9 /100 | #126 | Exceptional 7.3% |
| Jordanians | 91.5 /100 | #127 | Exceptional 7.3% |
| Zimbabweans | 91.5 /100 | #128 | Exceptional 7.3% |
| Slovenes | 89.2 /100 | #129 | Excellent 7.4% |
| Swedes | 88.4 /100 | #130 | Excellent 7.4% |
| Ukrainians | 88.2 /100 | #131 | Excellent 7.4% |
| Immigrants | Armenia | 87.4 /100 | #132 | Excellent 7.4% |
| Immigrants | Uganda | 86.5 /100 | #133 | Excellent 7.4% |
| Immigrants | Bolivia | 85.7 /100 | #134 | Excellent 7.4% |
| Immigrants | Northern Africa | 85.3 /100 | #135 | Excellent 7.4% |
| Immigrants | Morocco | 84.9 /100 | #136 | Excellent 7.4% |
| Immigrants | Cambodia | 84.6 /100 | #137 | Excellent 7.4% |
| Immigrants | Norway | 84.1 /100 | #138 | Excellent 7.4% |