Barbadian vs Ukrainian Female Poverty
COMPARE
Barbadian
Ukrainian
Female Poverty
Female Poverty Comparison
Barbadians
Ukrainians
15.9%
FEMALE POVERTY
0.0/ 100
METRIC RATING
274th/ 347
METRIC RANK
12.2%
FEMALE POVERTY
98.0/ 100
METRIC RATING
63rd/ 347
METRIC RANK
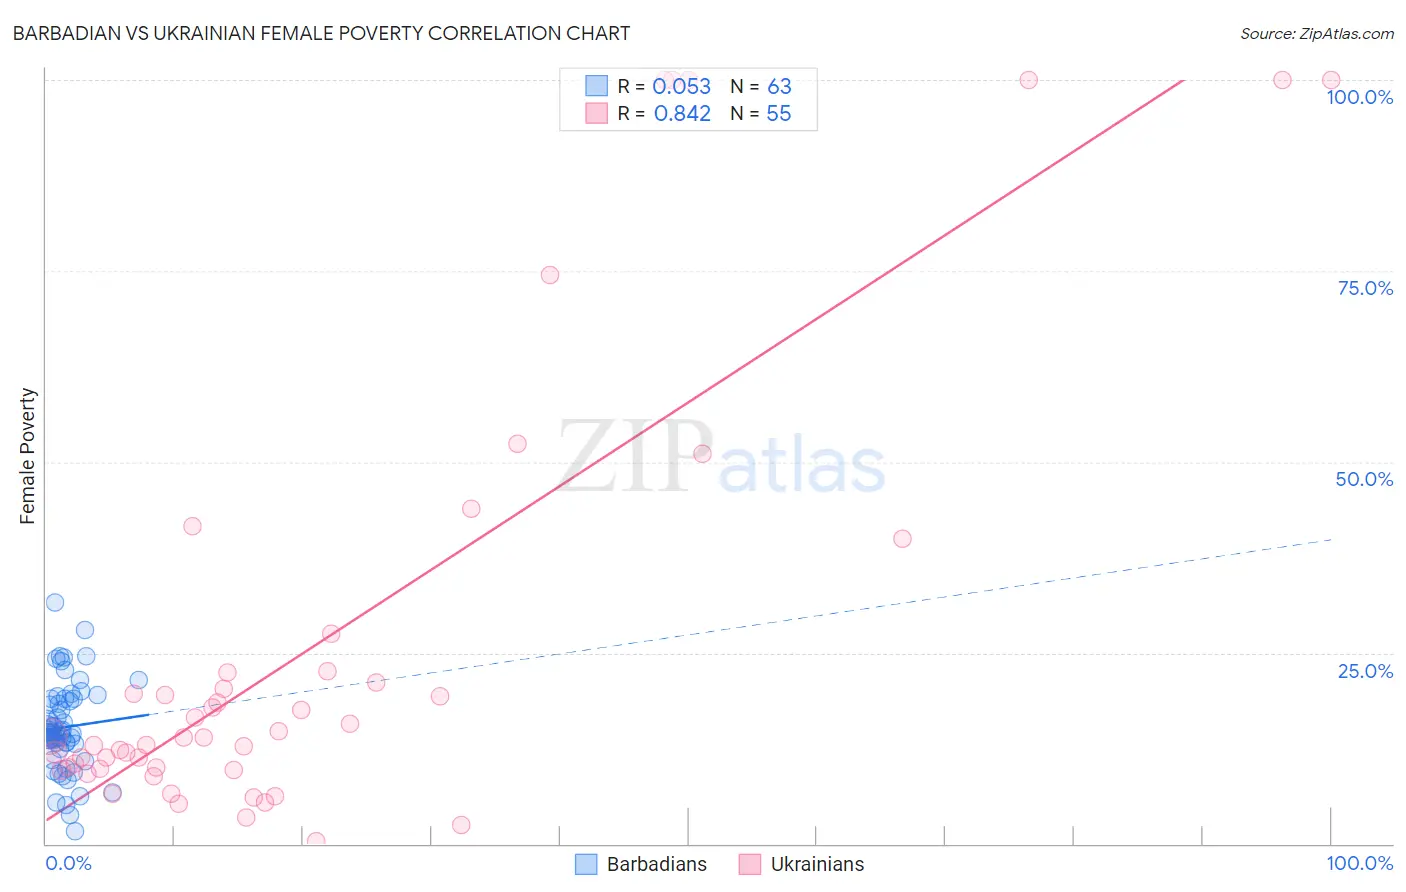
Barbadian vs Ukrainian Female Poverty Correlation Chart
The statistical analysis conducted on geographies consisting of 141,263,328 people shows a slight positive correlation between the proportion of Barbadians and poverty level among females in the United States with a correlation coefficient (R) of 0.053 and weighted average of 15.9%. Similarly, the statistical analysis conducted on geographies consisting of 448,134,896 people shows a very strong positive correlation between the proportion of Ukrainians and poverty level among females in the United States with a correlation coefficient (R) of 0.842 and weighted average of 12.2%, a difference of 30.8%.
Female Poverty Correlation Summary
| Measurement | Barbadian | Ukrainian |
| Minimum | 1.7% | 0.40% |
| Maximum | 31.5% | 100.0% |
| Range | 29.8% | 99.6% |
| Mean | 15.3% | 26.3% |
| Median | 14.6% | 13.9% |
| Interquartile 25% (IQ1) | 13.0% | 9.7% |
| Interquartile 75% (IQ3) | 18.9% | 22.6% |
| Interquartile Range (IQR) | 5.9% | 12.8% |
| Standard Deviation (Sample) | 5.8% | 29.3% |
| Standard Deviation (Population) | 5.8% | 29.1% |
Similar Demographics by Female Poverty
Demographics Similar to Barbadians by Female Poverty
In terms of female poverty, the demographic groups most similar to Barbadians are Haitian (15.9%, a difference of 0.0%), Belizean (15.9%, a difference of 0.010%), Immigrants from Barbados (16.0%, a difference of 0.070%), Central American (16.0%, a difference of 0.19%), and Immigrants from St. Vincent and the Grenadines (15.9%, a difference of 0.24%).
| Demographics | Rating | Rank | Female Poverty |
| Sub-Saharan Africans | 0.1 /100 | #267 | Tragic 15.8% |
| Immigrants | Nicaragua | 0.1 /100 | #268 | Tragic 15.8% |
| Iroquois | 0.1 /100 | #269 | Tragic 15.8% |
| Chickasaw | 0.1 /100 | #270 | Tragic 15.9% |
| Immigrants | St. Vincent and the Grenadines | 0.0 /100 | #271 | Tragic 15.9% |
| Belizeans | 0.0 /100 | #272 | Tragic 15.9% |
| Haitians | 0.0 /100 | #273 | Tragic 15.9% |
| Barbadians | 0.0 /100 | #274 | Tragic 15.9% |
| Immigrants | Barbados | 0.0 /100 | #275 | Tragic 16.0% |
| Central Americans | 0.0 /100 | #276 | Tragic 16.0% |
| Bangladeshis | 0.0 /100 | #277 | Tragic 16.0% |
| Immigrants | West Indies | 0.0 /100 | #278 | Tragic 16.1% |
| Immigrants | Bahamas | 0.0 /100 | #279 | Tragic 16.1% |
| Vietnamese | 0.0 /100 | #280 | Tragic 16.1% |
| West Indians | 0.0 /100 | #281 | Tragic 16.1% |
Demographics Similar to Ukrainians by Female Poverty
In terms of female poverty, the demographic groups most similar to Ukrainians are German (12.2%, a difference of 0.030%), Indian (Asian) (12.2%, a difference of 0.060%), Austrian (12.2%, a difference of 0.070%), Immigrants from Italy (12.2%, a difference of 0.080%), and Immigrants from Asia (12.2%, a difference of 0.10%).
| Demographics | Rating | Rank | Female Poverty |
| Estonians | 98.3 /100 | #56 | Exceptional 12.1% |
| Immigrants | Serbia | 98.3 /100 | #57 | Exceptional 12.1% |
| Scandinavians | 98.2 /100 | #58 | Exceptional 12.1% |
| Immigrants | Europe | 98.2 /100 | #59 | Exceptional 12.1% |
| Immigrants | Australia | 98.1 /100 | #60 | Exceptional 12.2% |
| Immigrants | Asia | 98.1 /100 | #61 | Exceptional 12.2% |
| Immigrants | Italy | 98.0 /100 | #62 | Exceptional 12.2% |
| Ukrainians | 98.0 /100 | #63 | Exceptional 12.2% |
| Germans | 98.0 /100 | #64 | Exceptional 12.2% |
| Indians (Asian) | 97.9 /100 | #65 | Exceptional 12.2% |
| Austrians | 97.9 /100 | #66 | Exceptional 12.2% |
| Immigrants | Eastern Asia | 97.8 /100 | #67 | Exceptional 12.2% |
| Immigrants | Netherlands | 97.8 /100 | #68 | Exceptional 12.2% |
| Swiss | 97.7 /100 | #69 | Exceptional 12.2% |
| Immigrants | Belgium | 97.7 /100 | #70 | Exceptional 12.2% |