German vs Ukrainian Female Poverty
COMPARE
German
Ukrainian
Female Poverty
Female Poverty Comparison
Germans
Ukrainians
12.2%
FEMALE POVERTY
98.0/ 100
METRIC RATING
64th/ 347
METRIC RANK
12.2%
FEMALE POVERTY
98.0/ 100
METRIC RATING
63rd/ 347
METRIC RANK
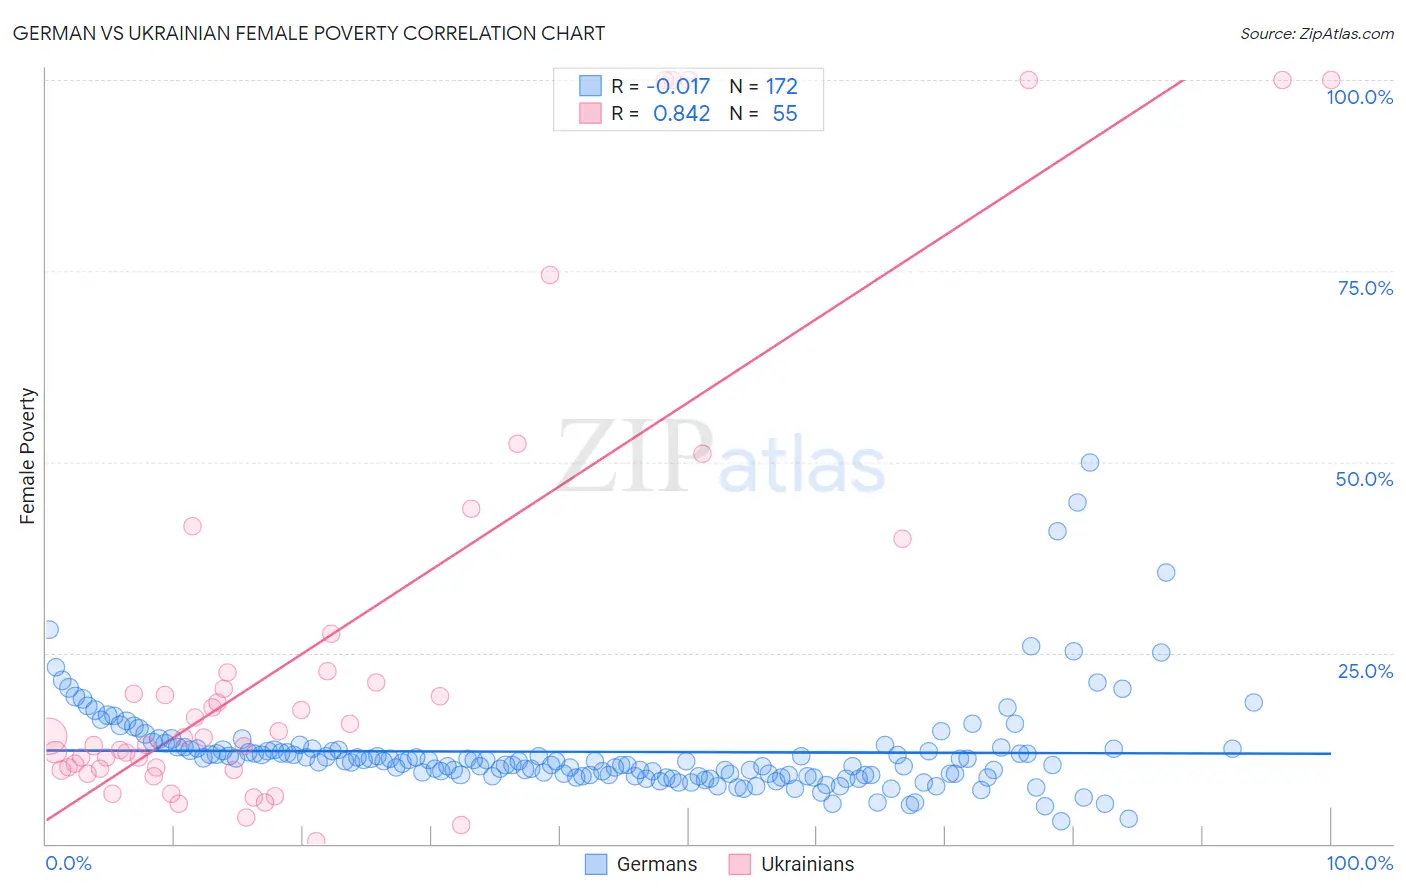
German vs Ukrainian Female Poverty Correlation Chart
The statistical analysis conducted on geographies consisting of 579,385,856 people shows no correlation between the proportion of Germans and poverty level among females in the United States with a correlation coefficient (R) of -0.017 and weighted average of 12.2%. Similarly, the statistical analysis conducted on geographies consisting of 448,134,896 people shows a very strong positive correlation between the proportion of Ukrainians and poverty level among females in the United States with a correlation coefficient (R) of 0.842 and weighted average of 12.2%, a difference of 0.030%.
Female Poverty Correlation Summary
| Measurement | German | Ukrainian |
| Minimum | 2.9% | 0.40% |
| Maximum | 50.0% | 100.0% |
| Range | 47.1% | 99.6% |
| Mean | 12.0% | 26.3% |
| Median | 10.8% | 13.9% |
| Interquartile 25% (IQ1) | 9.0% | 9.7% |
| Interquartile 75% (IQ3) | 12.5% | 22.6% |
| Interquartile Range (IQR) | 3.5% | 12.8% |
| Standard Deviation (Sample) | 6.3% | 29.3% |
| Standard Deviation (Population) | 6.3% | 29.1% |
Demographics Similar to Germans and Ukrainians by Female Poverty
In terms of female poverty, the demographic groups most similar to Germans are Indian (Asian) (12.2%, a difference of 0.030%), Austrian (12.2%, a difference of 0.040%), Immigrants from Italy (12.2%, a difference of 0.11%), Immigrants from Asia (12.2%, a difference of 0.13%), and Immigrants from Australia (12.2%, a difference of 0.14%). Similarly, the demographic groups most similar to Ukrainians are Indian (Asian) (12.2%, a difference of 0.060%), Austrian (12.2%, a difference of 0.070%), Immigrants from Italy (12.2%, a difference of 0.080%), Immigrants from Asia (12.2%, a difference of 0.10%), and Immigrants from Australia (12.2%, a difference of 0.11%).
| Demographics | Rating | Rank | Female Poverty |
| Immigrants | Austria | 98.7 /100 | #53 | Exceptional 12.0% |
| Immigrants | Philippines | 98.7 /100 | #54 | Exceptional 12.1% |
| Immigrants | Sri Lanka | 98.5 /100 | #55 | Exceptional 12.1% |
| Estonians | 98.3 /100 | #56 | Exceptional 12.1% |
| Immigrants | Serbia | 98.3 /100 | #57 | Exceptional 12.1% |
| Scandinavians | 98.2 /100 | #58 | Exceptional 12.1% |
| Immigrants | Europe | 98.2 /100 | #59 | Exceptional 12.1% |
| Immigrants | Australia | 98.1 /100 | #60 | Exceptional 12.2% |
| Immigrants | Asia | 98.1 /100 | #61 | Exceptional 12.2% |
| Immigrants | Italy | 98.0 /100 | #62 | Exceptional 12.2% |
| Ukrainians | 98.0 /100 | #63 | Exceptional 12.2% |
| Germans | 98.0 /100 | #64 | Exceptional 12.2% |
| Indians (Asian) | 97.9 /100 | #65 | Exceptional 12.2% |
| Austrians | 97.9 /100 | #66 | Exceptional 12.2% |
| Immigrants | Eastern Asia | 97.8 /100 | #67 | Exceptional 12.2% |
| Immigrants | Netherlands | 97.8 /100 | #68 | Exceptional 12.2% |
| Swiss | 97.7 /100 | #69 | Exceptional 12.2% |
| Immigrants | Belgium | 97.7 /100 | #70 | Exceptional 12.2% |
| Carpatho Rusyns | 97.6 /100 | #71 | Exceptional 12.2% |
| Cambodians | 97.5 /100 | #72 | Exceptional 12.2% |
| Zimbabweans | 97.5 /100 | #73 | Exceptional 12.3% |