Danish vs Bulgarian Unemployment Among Ages 45 to 54 years
COMPARE
Danish
Bulgarian
Unemployment Among Ages 45 to 54 years
Unemployment Among Ages 45 to 54 years Comparison
Danes
Bulgarians
3.9%
UNEMPLOYMENT AMONG AGES 45 TO 54 YEARS
100.0/ 100
METRIC RATING
5th/ 347
METRIC RANK
4.1%
UNEMPLOYMENT AMONG AGES 45 TO 54 YEARS
100.0/ 100
METRIC RATING
23rd/ 347
METRIC RANK
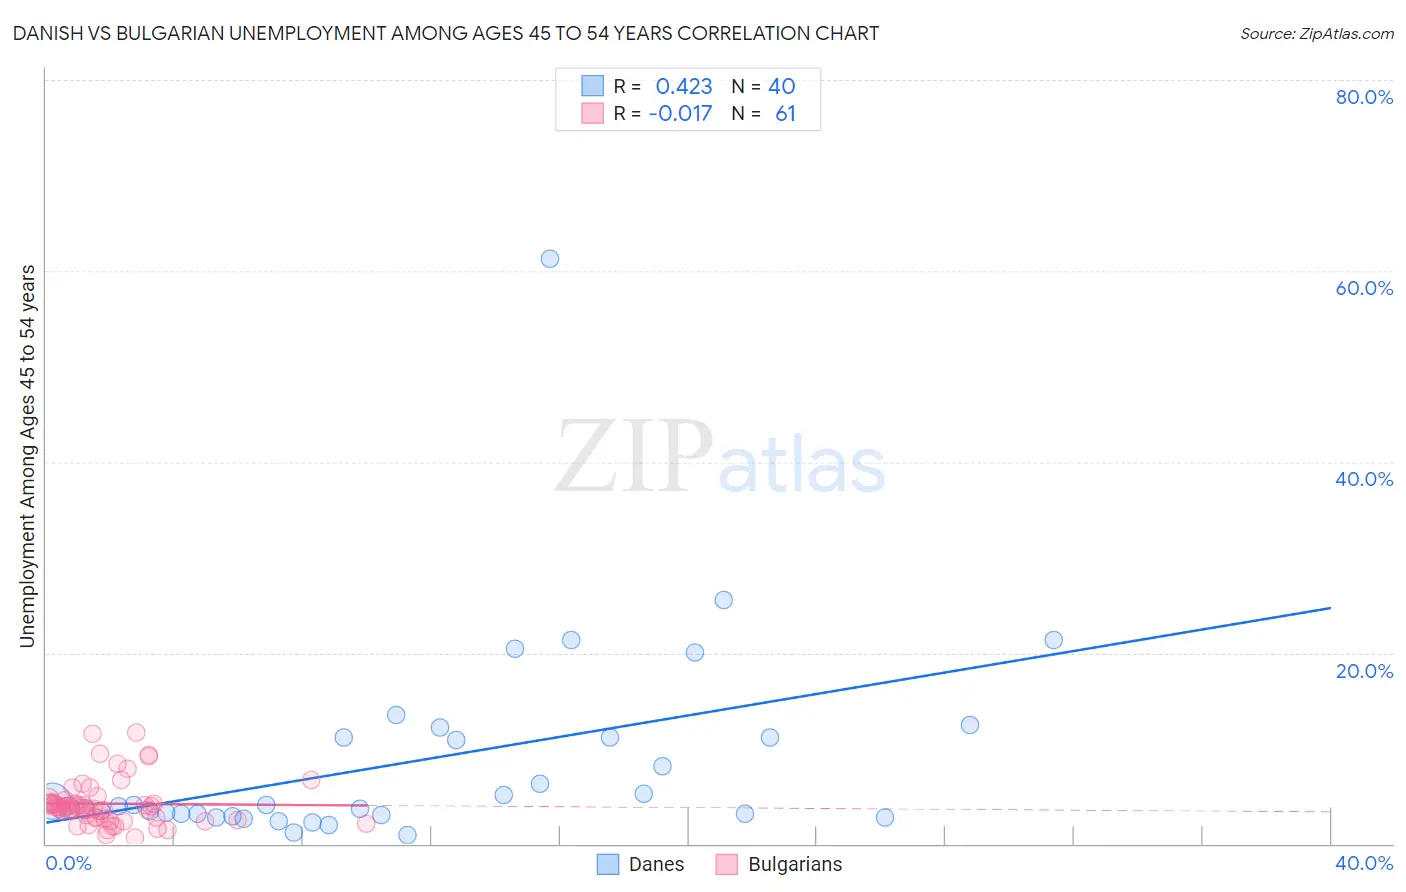
Danish vs Bulgarian Unemployment Among Ages 45 to 54 years Correlation Chart
The statistical analysis conducted on geographies consisting of 450,897,300 people shows a moderate positive correlation between the proportion of Danes and unemployment rate among population between the ages 45 and 54 in the United States with a correlation coefficient (R) of 0.423 and weighted average of 3.9%. Similarly, the statistical analysis conducted on geographies consisting of 203,004,749 people shows no correlation between the proportion of Bulgarians and unemployment rate among population between the ages 45 and 54 in the United States with a correlation coefficient (R) of -0.017 and weighted average of 4.1%, a difference of 5.1%.
Unemployment Among Ages 45 to 54 years Correlation Summary
| Measurement | Danish | Bulgarian |
| Minimum | 0.86% | 0.60% |
| Maximum | 61.3% | 11.7% |
| Range | 60.5% | 11.1% |
| Mean | 8.7% | 4.2% |
| Median | 4.0% | 3.9% |
| Interquartile 25% (IQ1) | 3.1% | 2.6% |
| Interquartile 75% (IQ3) | 11.1% | 4.4% |
| Interquartile Range (IQR) | 8.0% | 1.8% |
| Standard Deviation (Sample) | 10.7% | 2.4% |
| Standard Deviation (Population) | 10.6% | 2.4% |
Demographics Similar to Danes and Bulgarians by Unemployment Among Ages 45 to 54 years
In terms of unemployment among ages 45 to 54 years, the demographic groups most similar to Danes are Immigrants from India (3.9%, a difference of 0.17%), Immigrants from Cuba (3.9%, a difference of 0.22%), Immigrants from Venezuela (3.9%, a difference of 1.4%), Chinese (4.0%, a difference of 1.8%), and Czech (4.0%, a difference of 2.0%). Similarly, the demographic groups most similar to Bulgarians are Yugoslavian (4.1%, a difference of 0.010%), European (4.1%, a difference of 0.10%), English (4.1%, a difference of 0.42%), Swiss (4.1%, a difference of 0.58%), and Carpatho Rusyn (4.1%, a difference of 0.65%).
| Demographics | Rating | Rank | Unemployment Among Ages 45 to 54 years |
| Immigrants | India | 100.0 /100 | #4 | Exceptional 3.9% |
| Danes | 100.0 /100 | #5 | Exceptional 3.9% |
| Immigrants | Cuba | 100.0 /100 | #6 | Exceptional 3.9% |
| Immigrants | Venezuela | 100.0 /100 | #7 | Exceptional 3.9% |
| Chinese | 100.0 /100 | #8 | Exceptional 4.0% |
| Czechs | 100.0 /100 | #9 | Exceptional 4.0% |
| Venezuelans | 100.0 /100 | #10 | Exceptional 4.0% |
| Scandinavians | 100.0 /100 | #11 | Exceptional 4.0% |
| Swedes | 100.0 /100 | #12 | Exceptional 4.0% |
| Cubans | 100.0 /100 | #13 | Exceptional 4.0% |
| Immigrants | Bosnia and Herzegovina | 100.0 /100 | #14 | Exceptional 4.0% |
| Immigrants | Bolivia | 100.0 /100 | #15 | Exceptional 4.0% |
| Thais | 100.0 /100 | #16 | Exceptional 4.0% |
| Tongans | 100.0 /100 | #17 | Exceptional 4.1% |
| Germans | 100.0 /100 | #18 | Exceptional 4.1% |
| Swiss | 100.0 /100 | #19 | Exceptional 4.1% |
| English | 100.0 /100 | #20 | Exceptional 4.1% |
| Europeans | 100.0 /100 | #21 | Exceptional 4.1% |
| Yugoslavians | 100.0 /100 | #22 | Exceptional 4.1% |
| Bulgarians | 100.0 /100 | #23 | Exceptional 4.1% |
| Carpatho Rusyns | 100.0 /100 | #24 | Exceptional 4.1% |