Czechoslovakian vs Immigrants from Kuwait Child Poverty Among Girls Under 16
COMPARE
Czechoslovakian
Immigrants from Kuwait
Child Poverty Among Girls Under 16
Child Poverty Among Girls Under 16 Comparison
Czechoslovakians
Immigrants from Kuwait
15.5%
CHILD POVERTY AMONG GIRLS UNDER 16
89.0/ 100
METRIC RATING
135th/ 347
METRIC RANK
15.8%
CHILD POVERTY AMONG GIRLS UNDER 16
79.4/ 100
METRIC RATING
152nd/ 347
METRIC RANK
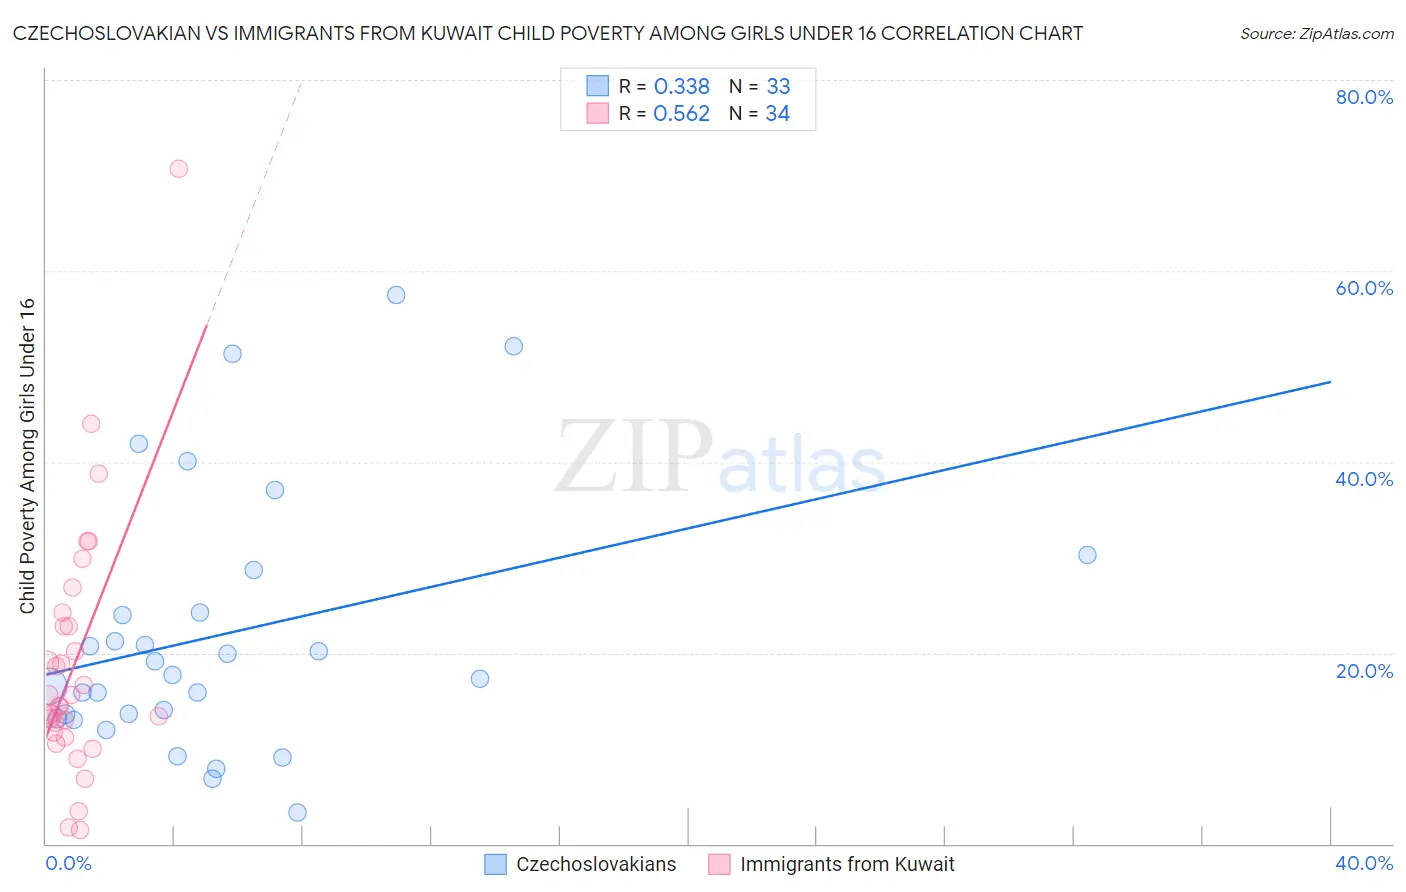
Czechoslovakian vs Immigrants from Kuwait Child Poverty Among Girls Under 16 Correlation Chart
The statistical analysis conducted on geographies consisting of 361,103,905 people shows a mild positive correlation between the proportion of Czechoslovakians and poverty level among girls under the age of 16 in the United States with a correlation coefficient (R) of 0.338 and weighted average of 15.5%. Similarly, the statistical analysis conducted on geographies consisting of 136,192,954 people shows a substantial positive correlation between the proportion of Immigrants from Kuwait and poverty level among girls under the age of 16 in the United States with a correlation coefficient (R) of 0.562 and weighted average of 15.8%, a difference of 2.3%.
Child Poverty Among Girls Under 16 Correlation Summary
| Measurement | Czechoslovakian | Immigrants from Kuwait |
| Minimum | 3.3% | 1.4% |
| Maximum | 57.5% | 70.8% |
| Range | 54.2% | 69.4% |
| Mean | 21.9% | 18.9% |
| Median | 17.6% | 15.0% |
| Interquartile 25% (IQ1) | 13.3% | 11.6% |
| Interquartile 75% (IQ3) | 26.5% | 22.8% |
| Interquartile Range (IQR) | 13.1% | 11.2% |
| Standard Deviation (Sample) | 13.6% | 13.4% |
| Standard Deviation (Population) | 13.4% | 13.2% |
Demographics Similar to Czechoslovakians and Immigrants from Kuwait by Child Poverty Among Girls Under 16
In terms of child poverty among girls under 16, the demographic groups most similar to Czechoslovakians are Native Hawaiian (15.5%, a difference of 0.020%), Immigrants from Spain (15.5%, a difference of 0.030%), South African (15.5%, a difference of 0.11%), Brazilian (15.4%, a difference of 0.19%), and Immigrants from Vietnam (15.5%, a difference of 0.24%). Similarly, the demographic groups most similar to Immigrants from Kuwait are Venezuelan (15.8%, a difference of 0.14%), Immigrants from Nepal (15.9%, a difference of 0.15%), Immigrants from Albania (15.8%, a difference of 0.24%), Immigrants from Hungary (15.8%, a difference of 0.28%), and Icelander (15.7%, a difference of 0.60%).
| Demographics | Rating | Rank | Child Poverty Among Girls Under 16 |
| Brazilians | 89.6 /100 | #133 | Excellent 15.4% |
| Immigrants | Spain | 89.1 /100 | #134 | Excellent 15.5% |
| Czechoslovakians | 89.0 /100 | #135 | Excellent 15.5% |
| Native Hawaiians | 89.0 /100 | #136 | Excellent 15.5% |
| South Africans | 88.7 /100 | #137 | Excellent 15.5% |
| Immigrants | Vietnam | 88.2 /100 | #138 | Excellent 15.5% |
| Armenians | 87.9 /100 | #139 | Excellent 15.5% |
| New Zealanders | 87.2 /100 | #140 | Excellent 15.6% |
| Immigrants | Jordan | 87.2 /100 | #141 | Excellent 15.6% |
| Canadians | 87.1 /100 | #142 | Excellent 15.6% |
| Immigrants | Peru | 86.6 /100 | #143 | Excellent 15.6% |
| Israelis | 86.3 /100 | #144 | Excellent 15.6% |
| Welsh | 85.4 /100 | #145 | Excellent 15.6% |
| Samoans | 84.2 /100 | #146 | Excellent 15.7% |
| Slavs | 83.1 /100 | #147 | Excellent 15.7% |
| Icelanders | 82.4 /100 | #148 | Excellent 15.7% |
| Immigrants | Hungary | 80.9 /100 | #149 | Excellent 15.8% |
| Immigrants | Albania | 80.7 /100 | #150 | Excellent 15.8% |
| Venezuelans | 80.1 /100 | #151 | Excellent 15.8% |
| Immigrants | Kuwait | 79.4 /100 | #152 | Good 15.8% |
| Immigrants | Nepal | 78.5 /100 | #153 | Good 15.9% |