Czechoslovakian vs Immigrants from Kuwait Currently Married
COMPARE
Czechoslovakian
Immigrants from Kuwait
Currently Married
Currently Married Comparison
Czechoslovakians
Immigrants from Kuwait
48.8%
CURRENTLY MARRIED
99.4/ 100
METRIC RATING
38th/ 347
METRIC RANK
46.1%
CURRENTLY MARRIED
21.7/ 100
METRIC RATING
197th/ 347
METRIC RANK
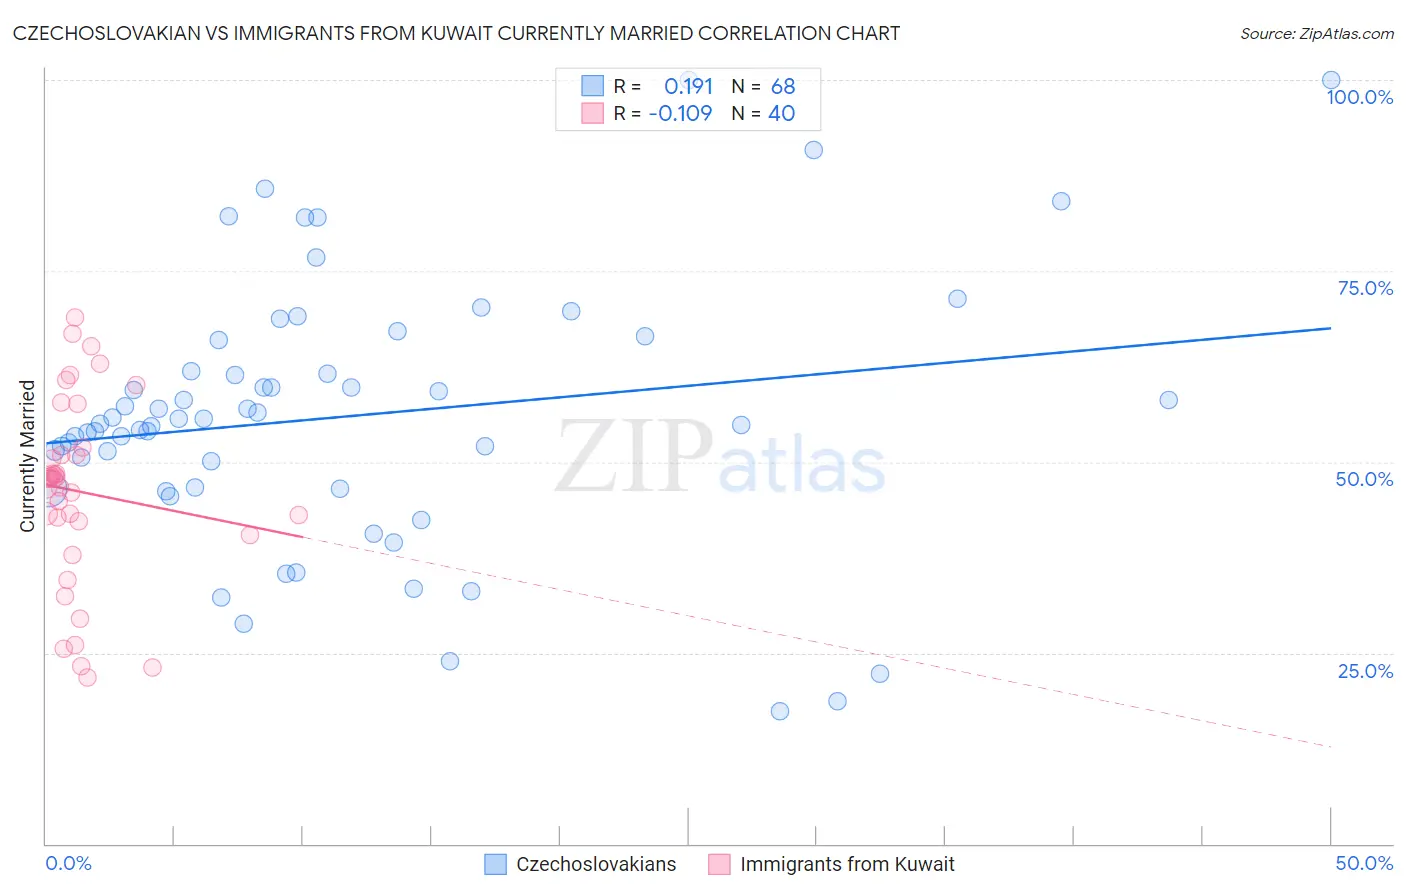
Czechoslovakian vs Immigrants from Kuwait Currently Married Correlation Chart
The statistical analysis conducted on geographies consisting of 368,635,685 people shows a poor positive correlation between the proportion of Czechoslovakians and percentage of population currently married in the United States with a correlation coefficient (R) of 0.191 and weighted average of 48.8%. Similarly, the statistical analysis conducted on geographies consisting of 136,899,142 people shows a poor negative correlation between the proportion of Immigrants from Kuwait and percentage of population currently married in the United States with a correlation coefficient (R) of -0.109 and weighted average of 46.1%, a difference of 5.9%.
Currently Married Correlation Summary
| Measurement | Czechoslovakian | Immigrants from Kuwait |
| Minimum | 17.3% | 21.7% |
| Maximum | 100.0% | 68.9% |
| Range | 82.7% | 47.2% |
| Mean | 56.0% | 46.1% |
| Median | 55.3% | 47.8% |
| Interquartile 25% (IQ1) | 46.6% | 41.4% |
| Interquartile 75% (IQ3) | 63.9% | 51.4% |
| Interquartile Range (IQR) | 17.3% | 10.0% |
| Standard Deviation (Sample) | 17.4% | 12.3% |
| Standard Deviation (Population) | 17.3% | 12.1% |
Similar Demographics by Currently Married
Demographics Similar to Czechoslovakians by Currently Married
In terms of currently married, the demographic groups most similar to Czechoslovakians are British (48.8%, a difference of 0.030%), Italian (48.8%, a difference of 0.040%), Hungarian (48.8%, a difference of 0.040%), Immigrants from Northern Europe (48.8%, a difference of 0.050%), and Immigrants from Canada (48.8%, a difference of 0.050%).
| Demographics | Rating | Rank | Currently Married |
| Poles | 99.5 /100 | #31 | Exceptional 48.9% |
| Immigrants | Hong Kong | 99.5 /100 | #32 | Exceptional 48.9% |
| Irish | 99.5 /100 | #33 | Exceptional 48.9% |
| Immigrants | Lithuania | 99.4 /100 | #34 | Exceptional 48.8% |
| Immigrants | Northern Europe | 99.4 /100 | #35 | Exceptional 48.8% |
| Italians | 99.4 /100 | #36 | Exceptional 48.8% |
| Hungarians | 99.4 /100 | #37 | Exceptional 48.8% |
| Czechoslovakians | 99.4 /100 | #38 | Exceptional 48.8% |
| British | 99.4 /100 | #39 | Exceptional 48.8% |
| Immigrants | Canada | 99.4 /100 | #40 | Exceptional 48.8% |
| Greeks | 99.3 /100 | #41 | Exceptional 48.8% |
| Finns | 99.3 /100 | #42 | Exceptional 48.8% |
| Scotch-Irish | 99.3 /100 | #43 | Exceptional 48.7% |
| Immigrants | North America | 99.3 /100 | #44 | Exceptional 48.7% |
| Belgians | 99.3 /100 | #45 | Exceptional 48.7% |
Demographics Similar to Immigrants from Kuwait by Currently Married
In terms of currently married, the demographic groups most similar to Immigrants from Kuwait are Immigrants from Bosnia and Herzegovina (46.1%, a difference of 0.030%), Immigrants from Colombia (46.1%, a difference of 0.040%), Immigrants from Nepal (46.1%, a difference of 0.10%), South American (46.1%, a difference of 0.11%), and Immigrants from Costa Rica (46.0%, a difference of 0.12%).
| Demographics | Rating | Rank | Currently Married |
| Choctaw | 29.1 /100 | #190 | Fair 46.3% |
| Immigrants | France | 27.7 /100 | #191 | Fair 46.2% |
| Soviet Union | 25.7 /100 | #192 | Fair 46.2% |
| Immigrants | Fiji | 25.0 /100 | #193 | Fair 46.2% |
| South Americans | 23.8 /100 | #194 | Fair 46.1% |
| Immigrants | Nepal | 23.7 /100 | #195 | Fair 46.1% |
| Immigrants | Bosnia and Herzegovina | 22.2 /100 | #196 | Fair 46.1% |
| Immigrants | Kuwait | 21.7 /100 | #197 | Fair 46.1% |
| Immigrants | Colombia | 21.0 /100 | #198 | Fair 46.1% |
| Immigrants | Costa Rica | 19.6 /100 | #199 | Poor 46.0% |
| Creek | 17.2 /100 | #200 | Poor 46.0% |
| Malaysians | 15.3 /100 | #201 | Poor 45.9% |
| Immigrants | Albania | 14.5 /100 | #202 | Poor 45.9% |
| Taiwanese | 11.7 /100 | #203 | Poor 45.8% |
| Immigrants | Spain | 11.6 /100 | #204 | Poor 45.8% |