Immigrants from Thailand vs Immigrants from Kuwait Child Poverty Among Girls Under 16
COMPARE
Immigrants from Thailand
Immigrants from Kuwait
Child Poverty Among Girls Under 16
Child Poverty Among Girls Under 16 Comparison
Immigrants from Thailand
Immigrants from Kuwait
17.7%
CHILD POVERTY AMONG GIRLS UNDER 16
6.3/ 100
METRIC RATING
212th/ 347
METRIC RANK
15.8%
CHILD POVERTY AMONG GIRLS UNDER 16
79.4/ 100
METRIC RATING
152nd/ 347
METRIC RANK
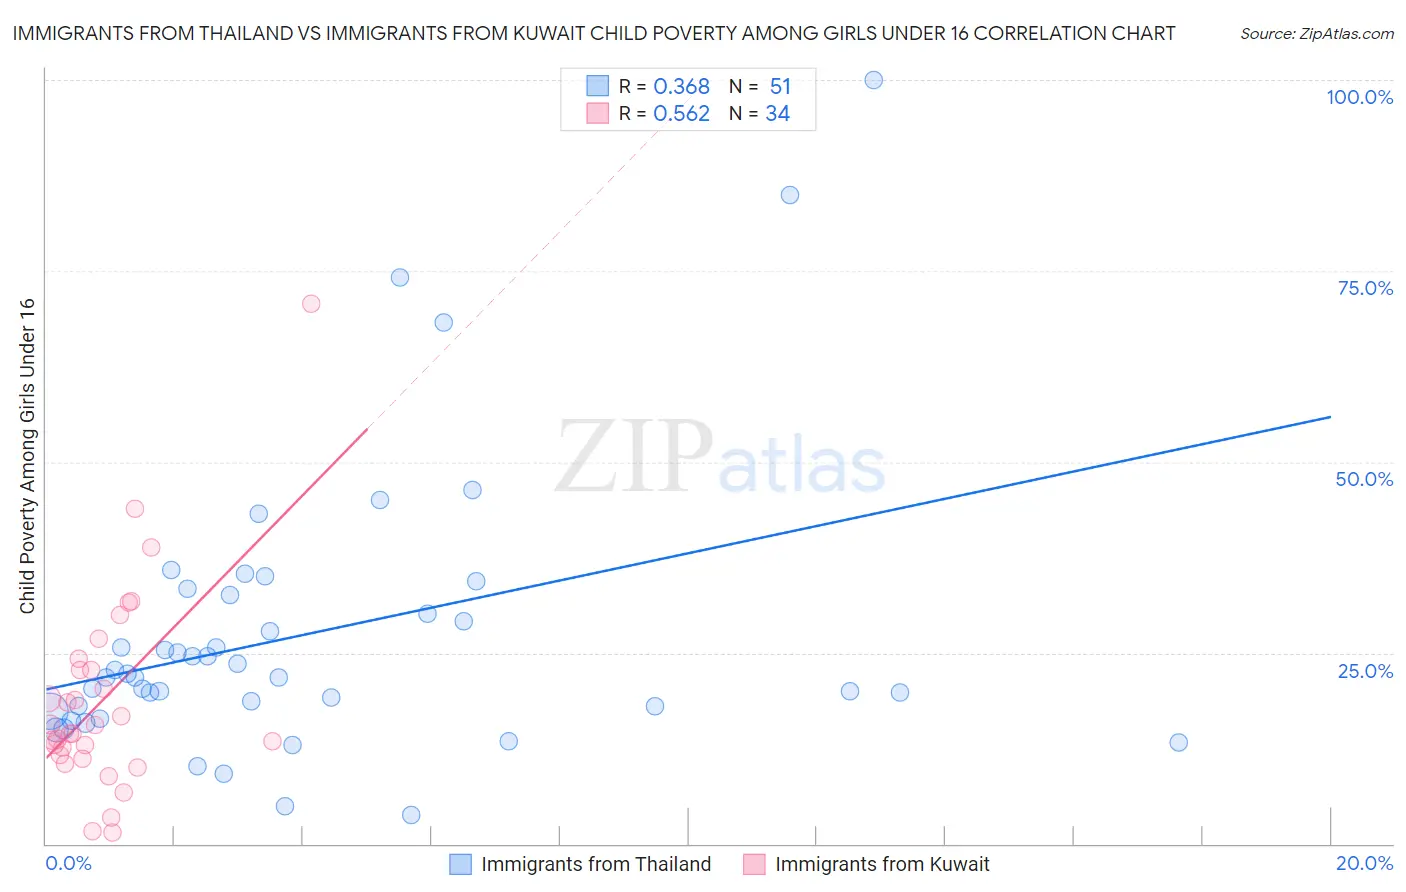
Immigrants from Thailand vs Immigrants from Kuwait Child Poverty Among Girls Under 16 Correlation Chart
The statistical analysis conducted on geographies consisting of 313,390,074 people shows a mild positive correlation between the proportion of Immigrants from Thailand and poverty level among girls under the age of 16 in the United States with a correlation coefficient (R) of 0.368 and weighted average of 17.7%. Similarly, the statistical analysis conducted on geographies consisting of 136,192,954 people shows a substantial positive correlation between the proportion of Immigrants from Kuwait and poverty level among girls under the age of 16 in the United States with a correlation coefficient (R) of 0.562 and weighted average of 15.8%, a difference of 12.1%.
Child Poverty Among Girls Under 16 Correlation Summary
| Measurement | Immigrants from Thailand | Immigrants from Kuwait |
| Minimum | 3.7% | 1.4% |
| Maximum | 100.0% | 70.8% |
| Range | 96.3% | 69.4% |
| Mean | 27.4% | 18.9% |
| Median | 21.8% | 15.0% |
| Interquartile 25% (IQ1) | 17.3% | 11.6% |
| Interquartile 75% (IQ3) | 32.5% | 22.8% |
| Interquartile Range (IQR) | 15.2% | 11.2% |
| Standard Deviation (Sample) | 18.8% | 13.4% |
| Standard Deviation (Population) | 18.6% | 13.2% |
Similar Demographics by Child Poverty Among Girls Under 16
Demographics Similar to Immigrants from Thailand by Child Poverty Among Girls Under 16
In terms of child poverty among girls under 16, the demographic groups most similar to Immigrants from Thailand are Immigrants from Eastern Africa (17.7%, a difference of 0.050%), Pennsylvania German (17.8%, a difference of 0.26%), Malaysian (17.8%, a difference of 0.28%), German Russian (17.8%, a difference of 0.28%), and Moroccan (17.8%, a difference of 0.38%).
| Demographics | Rating | Rank | Child Poverty Among Girls Under 16 |
| Immigrants | Cameroon | 12.6 /100 | #205 | Poor 17.4% |
| Delaware | 11.5 /100 | #206 | Poor 17.4% |
| Hmong | 10.6 /100 | #207 | Poor 17.5% |
| Sierra Leoneans | 8.9 /100 | #208 | Tragic 17.6% |
| Panamanians | 8.7 /100 | #209 | Tragic 17.6% |
| Immigrants | Immigrants | 7.3 /100 | #210 | Tragic 17.7% |
| Immigrants | Eastern Africa | 6.4 /100 | #211 | Tragic 17.7% |
| Immigrants | Thailand | 6.3 /100 | #212 | Tragic 17.7% |
| Pennsylvania Germans | 5.7 /100 | #213 | Tragic 17.8% |
| Malaysians | 5.7 /100 | #214 | Tragic 17.8% |
| German Russians | 5.7 /100 | #215 | Tragic 17.8% |
| Moroccans | 5.5 /100 | #216 | Tragic 17.8% |
| Japanese | 5.3 /100 | #217 | Tragic 17.8% |
| Alaska Natives | 5.2 /100 | #218 | Tragic 17.8% |
| Immigrants | Panama | 4.7 /100 | #219 | Tragic 17.9% |
Demographics Similar to Immigrants from Kuwait by Child Poverty Among Girls Under 16
In terms of child poverty among girls under 16, the demographic groups most similar to Immigrants from Kuwait are Venezuelan (15.8%, a difference of 0.14%), Immigrants from Nepal (15.9%, a difference of 0.15%), Immigrants from Albania (15.8%, a difference of 0.24%), Immigrants from Hungary (15.8%, a difference of 0.28%), and Immigrants from Chile (15.9%, a difference of 0.46%).
| Demographics | Rating | Rank | Child Poverty Among Girls Under 16 |
| Welsh | 85.4 /100 | #145 | Excellent 15.6% |
| Samoans | 84.2 /100 | #146 | Excellent 15.7% |
| Slavs | 83.1 /100 | #147 | Excellent 15.7% |
| Icelanders | 82.4 /100 | #148 | Excellent 15.7% |
| Immigrants | Hungary | 80.9 /100 | #149 | Excellent 15.8% |
| Immigrants | Albania | 80.7 /100 | #150 | Excellent 15.8% |
| Venezuelans | 80.1 /100 | #151 | Excellent 15.8% |
| Immigrants | Kuwait | 79.4 /100 | #152 | Good 15.8% |
| Immigrants | Nepal | 78.5 /100 | #153 | Good 15.9% |
| Immigrants | Chile | 76.7 /100 | #154 | Good 15.9% |
| Syrians | 76.7 /100 | #155 | Good 15.9% |
| Immigrants | Fiji | 76.1 /100 | #156 | Good 15.9% |
| Colombians | 76.1 /100 | #157 | Good 15.9% |
| Guamanians/Chamorros | 75.3 /100 | #158 | Good 15.9% |
| Slovaks | 75.2 /100 | #159 | Good 15.9% |