Cuban vs Immigrants from Denmark GED/Equivalency
COMPARE
Cuban
Immigrants from Denmark
GED/Equivalency
GED/Equivalency Comparison
Cubans
Immigrants from Denmark
82.0%
GED/EQUIVALENCY
0.0/ 100
METRIC RATING
291st/ 347
METRIC RANK
88.0%
GED/EQUIVALENCY
99.4/ 100
METRIC RATING
56th/ 347
METRIC RANK
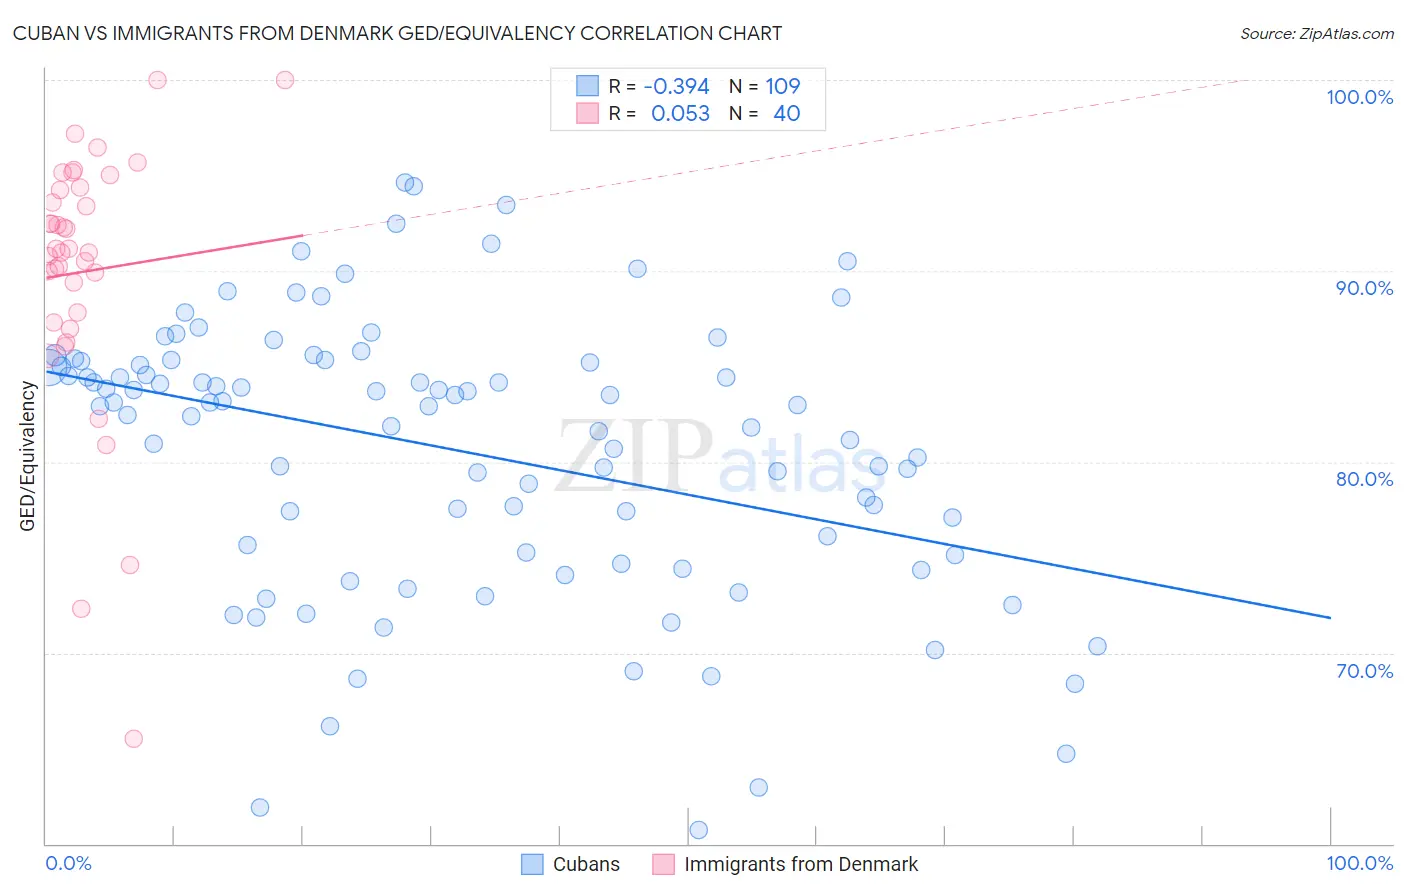
Cuban vs Immigrants from Denmark GED/Equivalency Correlation Chart
The statistical analysis conducted on geographies consisting of 449,373,028 people shows a mild negative correlation between the proportion of Cubans and percentage of population with at least ged/equivalency education in the United States with a correlation coefficient (R) of -0.394 and weighted average of 82.0%. Similarly, the statistical analysis conducted on geographies consisting of 136,430,715 people shows a slight positive correlation between the proportion of Immigrants from Denmark and percentage of population with at least ged/equivalency education in the United States with a correlation coefficient (R) of 0.053 and weighted average of 88.0%, a difference of 7.2%.
GED/Equivalency Correlation Summary
| Measurement | Cuban | Immigrants from Denmark |
| Minimum | 60.7% | 65.5% |
| Maximum | 94.6% | 100.0% |
| Range | 33.9% | 34.5% |
| Mean | 80.6% | 90.0% |
| Median | 82.9% | 91.1% |
| Interquartile 25% (IQ1) | 75.2% | 87.6% |
| Interquartile 75% (IQ3) | 85.2% | 94.3% |
| Interquartile Range (IQR) | 10.1% | 6.7% |
| Standard Deviation (Sample) | 7.2% | 7.0% |
| Standard Deviation (Population) | 7.2% | 6.9% |
Similar Demographics by GED/Equivalency
Demographics Similar to Cubans by GED/Equivalency
In terms of ged/equivalency, the demographic groups most similar to Cubans are Haitian (82.1%, a difference of 0.020%), Paiute (82.0%, a difference of 0.040%), British West Indian (82.0%, a difference of 0.040%), Immigrants from St. Vincent and the Grenadines (82.0%, a difference of 0.070%), and Nepalese (81.9%, a difference of 0.13%).
| Demographics | Rating | Rank | GED/Equivalency |
| Immigrants | Barbados | 0.1 /100 | #284 | Tragic 82.4% |
| Cajuns | 0.0 /100 | #285 | Tragic 82.4% |
| Immigrants | West Indies | 0.0 /100 | #286 | Tragic 82.4% |
| Japanese | 0.0 /100 | #287 | Tragic 82.4% |
| Pueblo | 0.0 /100 | #288 | Tragic 82.3% |
| Immigrants | Cambodia | 0.0 /100 | #289 | Tragic 82.2% |
| Haitians | 0.0 /100 | #290 | Tragic 82.1% |
| Cubans | 0.0 /100 | #291 | Tragic 82.0% |
| Paiute | 0.0 /100 | #292 | Tragic 82.0% |
| British West Indians | 0.0 /100 | #293 | Tragic 82.0% |
| Immigrants | St. Vincent and the Grenadines | 0.0 /100 | #294 | Tragic 82.0% |
| Nepalese | 0.0 /100 | #295 | Tragic 81.9% |
| Vietnamese | 0.0 /100 | #296 | Tragic 81.9% |
| Immigrants | Bangladesh | 0.0 /100 | #297 | Tragic 81.9% |
| Ute | 0.0 /100 | #298 | Tragic 81.8% |
Demographics Similar to Immigrants from Denmark by GED/Equivalency
In terms of ged/equivalency, the demographic groups most similar to Immigrants from Denmark are Soviet Union (88.0%, a difference of 0.020%), New Zealander (88.0%, a difference of 0.020%), Immigrants from Netherlands (88.0%, a difference of 0.030%), Zimbabwean (88.0%, a difference of 0.030%), and Immigrants from South Africa (88.0%, a difference of 0.030%).
| Demographics | Rating | Rank | GED/Equivalency |
| Australians | 99.5 /100 | #49 | Exceptional 88.1% |
| Immigrants | Korea | 99.5 /100 | #50 | Exceptional 88.1% |
| Immigrants | Netherlands | 99.4 /100 | #51 | Exceptional 88.0% |
| Zimbabweans | 99.4 /100 | #52 | Exceptional 88.0% |
| Immigrants | South Africa | 99.4 /100 | #53 | Exceptional 88.0% |
| Soviet Union | 99.4 /100 | #54 | Exceptional 88.0% |
| New Zealanders | 99.4 /100 | #55 | Exceptional 88.0% |
| Immigrants | Denmark | 99.4 /100 | #56 | Exceptional 88.0% |
| Immigrants | Czechoslovakia | 99.3 /100 | #57 | Exceptional 87.9% |
| Northern Europeans | 99.3 /100 | #58 | Exceptional 87.9% |
| Serbians | 99.3 /100 | #59 | Exceptional 87.9% |
| Scandinavians | 99.3 /100 | #60 | Exceptional 87.9% |
| Europeans | 99.3 /100 | #61 | Exceptional 87.9% |
| Germans | 99.3 /100 | #62 | Exceptional 87.9% |
| Immigrants | Turkey | 99.2 /100 | #63 | Exceptional 87.9% |