Cuban vs Cheyenne Receiving Food Stamps
COMPARE
Cuban
Cheyenne
Receiving Food Stamps
Receiving Food Stamps Comparison
Cubans
Cheyenne
18.2%
RECEIVING FOOD STAMPS
0.0/ 100
METRIC RATING
326th/ 347
METRIC RANK
14.3%
RECEIVING FOOD STAMPS
0.2/ 100
METRIC RATING
266th/ 347
METRIC RANK
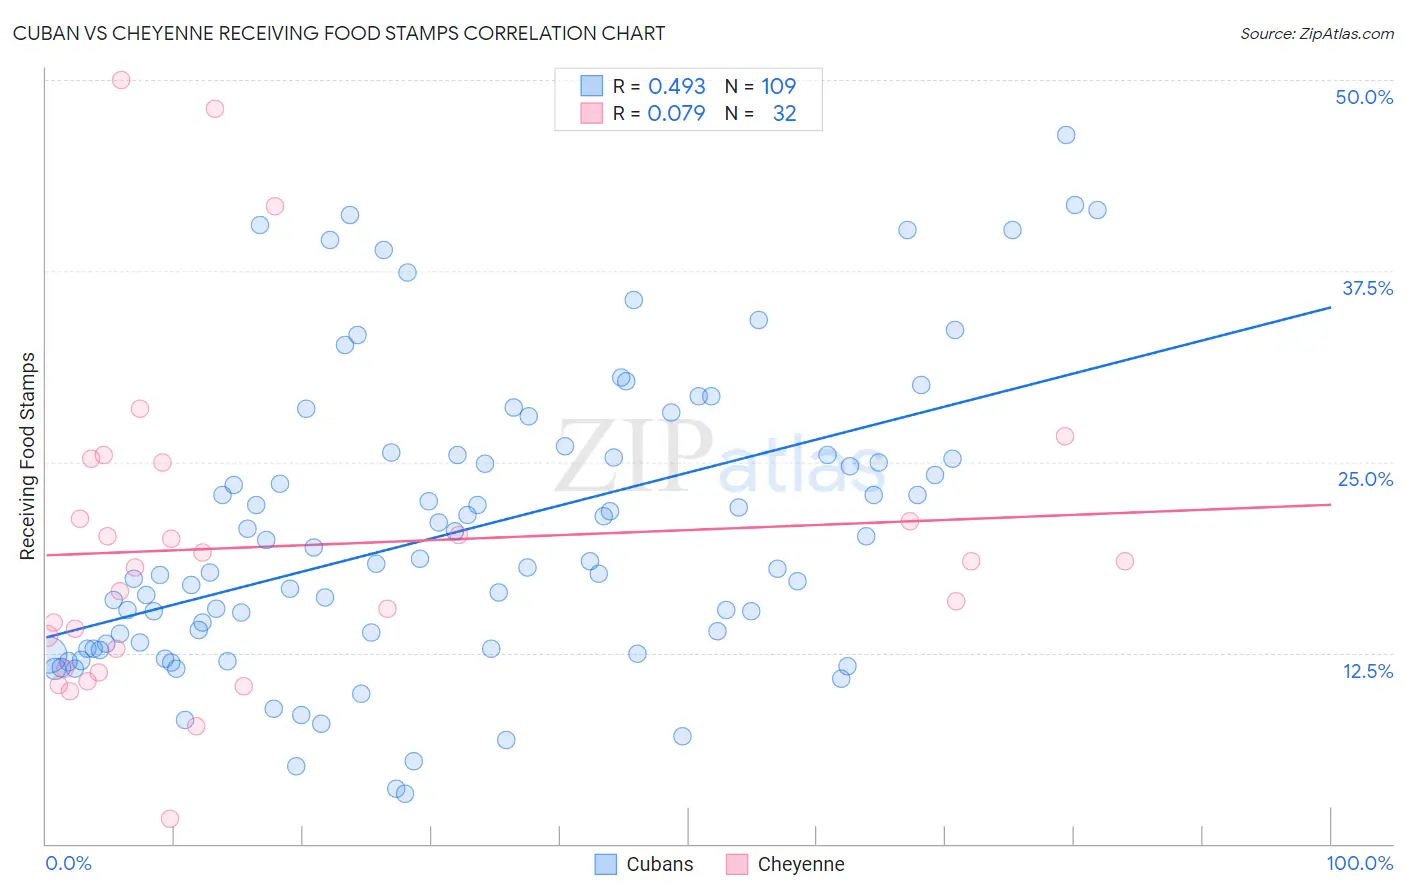
Cuban vs Cheyenne Receiving Food Stamps Correlation Chart
The statistical analysis conducted on geographies consisting of 447,765,470 people shows a moderate positive correlation between the proportion of Cubans and percentage of population receiving government assistance and/or food stamps in the United States with a correlation coefficient (R) of 0.493 and weighted average of 18.2%. Similarly, the statistical analysis conducted on geographies consisting of 80,695,470 people shows a slight positive correlation between the proportion of Cheyenne and percentage of population receiving government assistance and/or food stamps in the United States with a correlation coefficient (R) of 0.079 and weighted average of 14.3%, a difference of 27.5%.
Receiving Food Stamps Correlation Summary
| Measurement | Cuban | Cheyenne |
| Minimum | 3.3% | 1.6% |
| Maximum | 46.4% | 50.0% |
| Range | 43.1% | 48.4% |
| Mean | 20.4% | 19.5% |
| Median | 18.3% | 18.3% |
| Interquartile 25% (IQ1) | 12.8% | 12.1% |
| Interquartile 75% (IQ3) | 25.5% | 23.2% |
| Interquartile Range (IQR) | 12.7% | 11.0% |
| Standard Deviation (Sample) | 9.6% | 10.8% |
| Standard Deviation (Population) | 9.6% | 10.6% |
Similar Demographics by Receiving Food Stamps
Demographics Similar to Cubans by Receiving Food Stamps
In terms of receiving food stamps, the demographic groups most similar to Cubans are Immigrants from Haiti (18.2%, a difference of 0.11%), Apache (18.3%, a difference of 0.31%), Colville (18.3%, a difference of 0.52%), Immigrants from Dominica (18.4%, a difference of 0.98%), and British West Indian (17.9%, a difference of 1.9%).
| Demographics | Rating | Rank | Receiving Food Stamps |
| Immigrants | St. Vincent and the Grenadines | 0.0 /100 | #319 | Tragic 17.2% |
| Immigrants | Nicaragua | 0.0 /100 | #320 | Tragic 17.2% |
| Natives/Alaskans | 0.0 /100 | #321 | Tragic 17.3% |
| Immigrants | Grenada | 0.0 /100 | #322 | Tragic 17.8% |
| Haitians | 0.0 /100 | #323 | Tragic 17.8% |
| British West Indians | 0.0 /100 | #324 | Tragic 17.9% |
| Immigrants | Haiti | 0.0 /100 | #325 | Tragic 18.2% |
| Cubans | 0.0 /100 | #326 | Tragic 18.2% |
| Apache | 0.0 /100 | #327 | Tragic 18.3% |
| Colville | 0.0 /100 | #328 | Tragic 18.3% |
| Immigrants | Dominica | 0.0 /100 | #329 | Tragic 18.4% |
| Pima | 0.0 /100 | #330 | Tragic 19.0% |
| Immigrants | Caribbean | 0.0 /100 | #331 | Tragic 19.6% |
| Pueblo | 0.0 /100 | #332 | Tragic 19.9% |
| Inupiat | 0.0 /100 | #333 | Tragic 20.1% |
Demographics Similar to Cheyenne by Receiving Food Stamps
In terms of receiving food stamps, the demographic groups most similar to Cheyenne are Blackfeet (14.3%, a difference of 0.080%), Immigrants from Uzbekistan (14.3%, a difference of 0.14%), Dutch West Indian (14.3%, a difference of 0.22%), Paiute (14.3%, a difference of 0.23%), and Immigrants from Portugal (14.3%, a difference of 0.23%).
| Demographics | Rating | Rank | Receiving Food Stamps |
| Creek | 0.3 /100 | #259 | Tragic 14.1% |
| Central Americans | 0.3 /100 | #260 | Tragic 14.1% |
| Immigrants | Congo | 0.3 /100 | #261 | Tragic 14.1% |
| Paiute | 0.2 /100 | #262 | Tragic 14.3% |
| Immigrants | Portugal | 0.2 /100 | #263 | Tragic 14.3% |
| Immigrants | Uzbekistan | 0.2 /100 | #264 | Tragic 14.3% |
| Blackfeet | 0.2 /100 | #265 | Tragic 14.3% |
| Cheyenne | 0.2 /100 | #266 | Tragic 14.3% |
| Dutch West Indians | 0.2 /100 | #267 | Tragic 14.3% |
| Guatemalans | 0.1 /100 | #268 | Tragic 14.4% |
| Nepalese | 0.1 /100 | #269 | Tragic 14.6% |
| Mexicans | 0.1 /100 | #270 | Tragic 14.6% |
| Immigrants | Guatemala | 0.1 /100 | #271 | Tragic 14.6% |
| Chippewa | 0.1 /100 | #272 | Tragic 14.7% |
| Alaskan Athabascans | 0.1 /100 | #273 | Tragic 14.7% |