Cuban vs Immigrants from Kazakhstan Receiving Food Stamps
COMPARE
Cuban
Immigrants from Kazakhstan
Receiving Food Stamps
Receiving Food Stamps Comparison
Cubans
Immigrants from Kazakhstan
18.2%
RECEIVING FOOD STAMPS
0.0/ 100
METRIC RATING
326th/ 347
METRIC RANK
11.1%
RECEIVING FOOD STAMPS
81.7/ 100
METRIC RATING
152nd/ 347
METRIC RANK
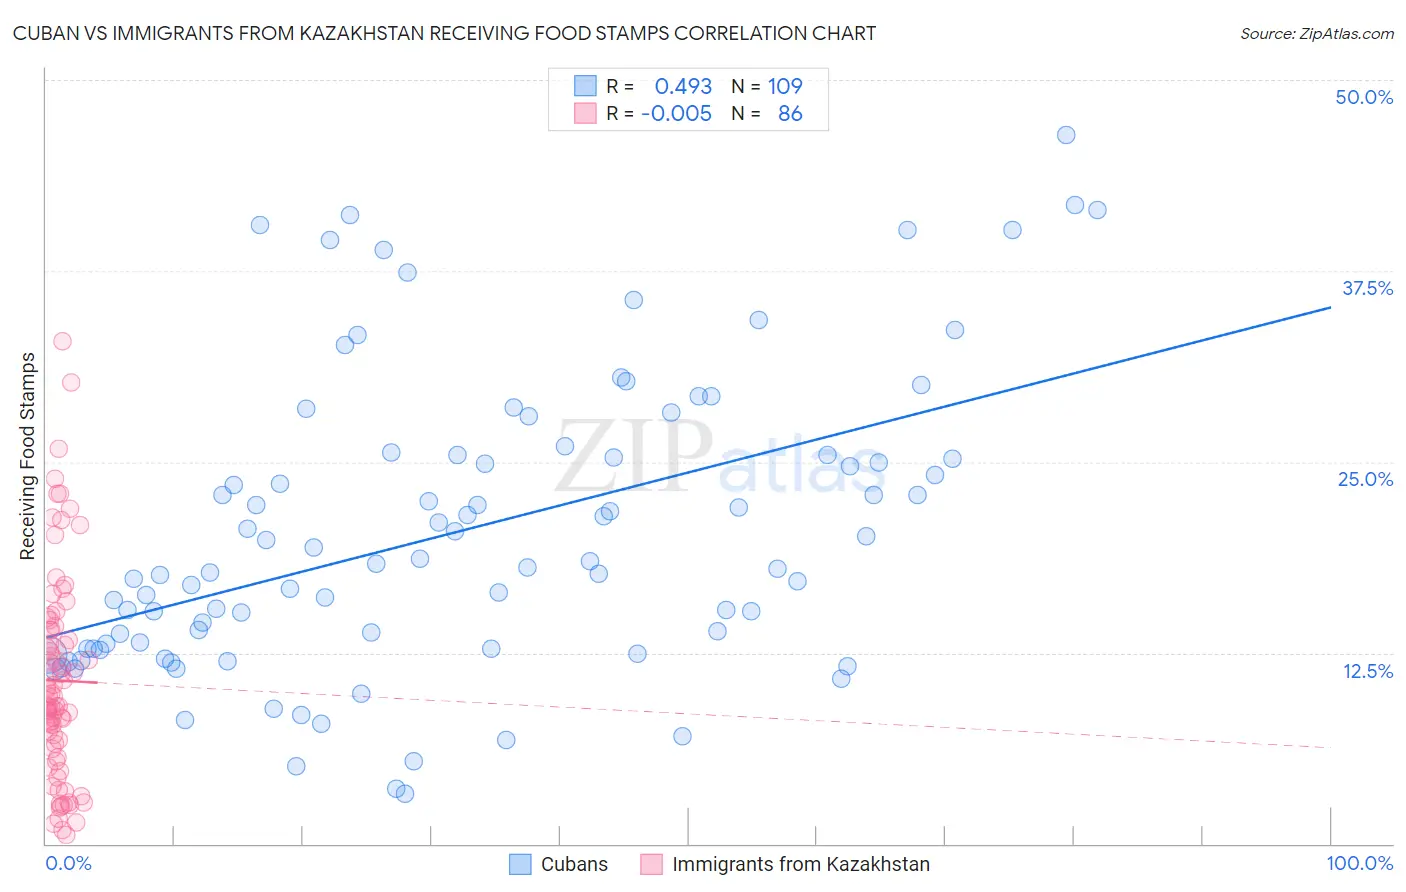
Cuban vs Immigrants from Kazakhstan Receiving Food Stamps Correlation Chart
The statistical analysis conducted on geographies consisting of 447,765,470 people shows a moderate positive correlation between the proportion of Cubans and percentage of population receiving government assistance and/or food stamps in the United States with a correlation coefficient (R) of 0.493 and weighted average of 18.2%. Similarly, the statistical analysis conducted on geographies consisting of 124,341,154 people shows no correlation between the proportion of Immigrants from Kazakhstan and percentage of population receiving government assistance and/or food stamps in the United States with a correlation coefficient (R) of -0.005 and weighted average of 11.1%, a difference of 63.8%.
Receiving Food Stamps Correlation Summary
| Measurement | Cuban | Immigrants from Kazakhstan |
| Minimum | 3.3% | 0.60% |
| Maximum | 46.4% | 32.9% |
| Range | 43.1% | 32.3% |
| Mean | 20.4% | 10.7% |
| Median | 18.3% | 9.3% |
| Interquartile 25% (IQ1) | 12.8% | 6.2% |
| Interquartile 75% (IQ3) | 25.5% | 14.0% |
| Interquartile Range (IQR) | 12.7% | 7.8% |
| Standard Deviation (Sample) | 9.6% | 6.8% |
| Standard Deviation (Population) | 9.6% | 6.7% |
Similar Demographics by Receiving Food Stamps
Demographics Similar to Cubans by Receiving Food Stamps
In terms of receiving food stamps, the demographic groups most similar to Cubans are Immigrants from Haiti (18.2%, a difference of 0.11%), Apache (18.3%, a difference of 0.31%), Colville (18.3%, a difference of 0.52%), Immigrants from Dominica (18.4%, a difference of 0.98%), and British West Indian (17.9%, a difference of 1.9%).
| Demographics | Rating | Rank | Receiving Food Stamps |
| Immigrants | St. Vincent and the Grenadines | 0.0 /100 | #319 | Tragic 17.2% |
| Immigrants | Nicaragua | 0.0 /100 | #320 | Tragic 17.2% |
| Natives/Alaskans | 0.0 /100 | #321 | Tragic 17.3% |
| Immigrants | Grenada | 0.0 /100 | #322 | Tragic 17.8% |
| Haitians | 0.0 /100 | #323 | Tragic 17.8% |
| British West Indians | 0.0 /100 | #324 | Tragic 17.9% |
| Immigrants | Haiti | 0.0 /100 | #325 | Tragic 18.2% |
| Cubans | 0.0 /100 | #326 | Tragic 18.2% |
| Apache | 0.0 /100 | #327 | Tragic 18.3% |
| Colville | 0.0 /100 | #328 | Tragic 18.3% |
| Immigrants | Dominica | 0.0 /100 | #329 | Tragic 18.4% |
| Pima | 0.0 /100 | #330 | Tragic 19.0% |
| Immigrants | Caribbean | 0.0 /100 | #331 | Tragic 19.6% |
| Pueblo | 0.0 /100 | #332 | Tragic 19.9% |
| Inupiat | 0.0 /100 | #333 | Tragic 20.1% |
Demographics Similar to Immigrants from Kazakhstan by Receiving Food Stamps
In terms of receiving food stamps, the demographic groups most similar to Immigrants from Kazakhstan are Immigrants from Spain (11.1%, a difference of 0.0%), Lebanese (11.1%, a difference of 0.020%), Armenian (11.1%, a difference of 0.080%), Immigrants from Argentina (11.2%, a difference of 0.33%), and Soviet Union (11.1%, a difference of 0.36%).
| Demographics | Rating | Rank | Receiving Food Stamps |
| Hungarians | 85.1 /100 | #145 | Excellent 11.0% |
| Taiwanese | 84.2 /100 | #146 | Excellent 11.0% |
| Whites/Caucasians | 83.9 /100 | #147 | Excellent 11.1% |
| Immigrants | South Eastern Asia | 83.3 /100 | #148 | Excellent 11.1% |
| Brazilians | 83.2 /100 | #149 | Excellent 11.1% |
| Soviet Union | 83.1 /100 | #150 | Excellent 11.1% |
| Immigrants | Spain | 81.7 /100 | #151 | Excellent 11.1% |
| Immigrants | Kazakhstan | 81.7 /100 | #152 | Excellent 11.1% |
| Lebanese | 81.6 /100 | #153 | Excellent 11.1% |
| Armenians | 81.4 /100 | #154 | Excellent 11.1% |
| Immigrants | Argentina | 80.4 /100 | #155 | Excellent 11.2% |
| Immigrants | Afghanistan | 75.6 /100 | #156 | Good 11.3% |
| Immigrants | Lebanon | 75.2 /100 | #157 | Good 11.3% |
| Immigrants | Bosnia and Herzegovina | 72.6 /100 | #158 | Good 11.3% |
| Immigrants | Oceania | 70.4 /100 | #159 | Good 11.4% |