Cuban vs Immigrants from Dominica Receiving Food Stamps
COMPARE
Cuban
Immigrants from Dominica
Receiving Food Stamps
Receiving Food Stamps Comparison
Cubans
Immigrants from Dominica
18.2%
RECEIVING FOOD STAMPS
0.0/ 100
METRIC RATING
326th/ 347
METRIC RANK
18.4%
RECEIVING FOOD STAMPS
0.0/ 100
METRIC RATING
329th/ 347
METRIC RANK
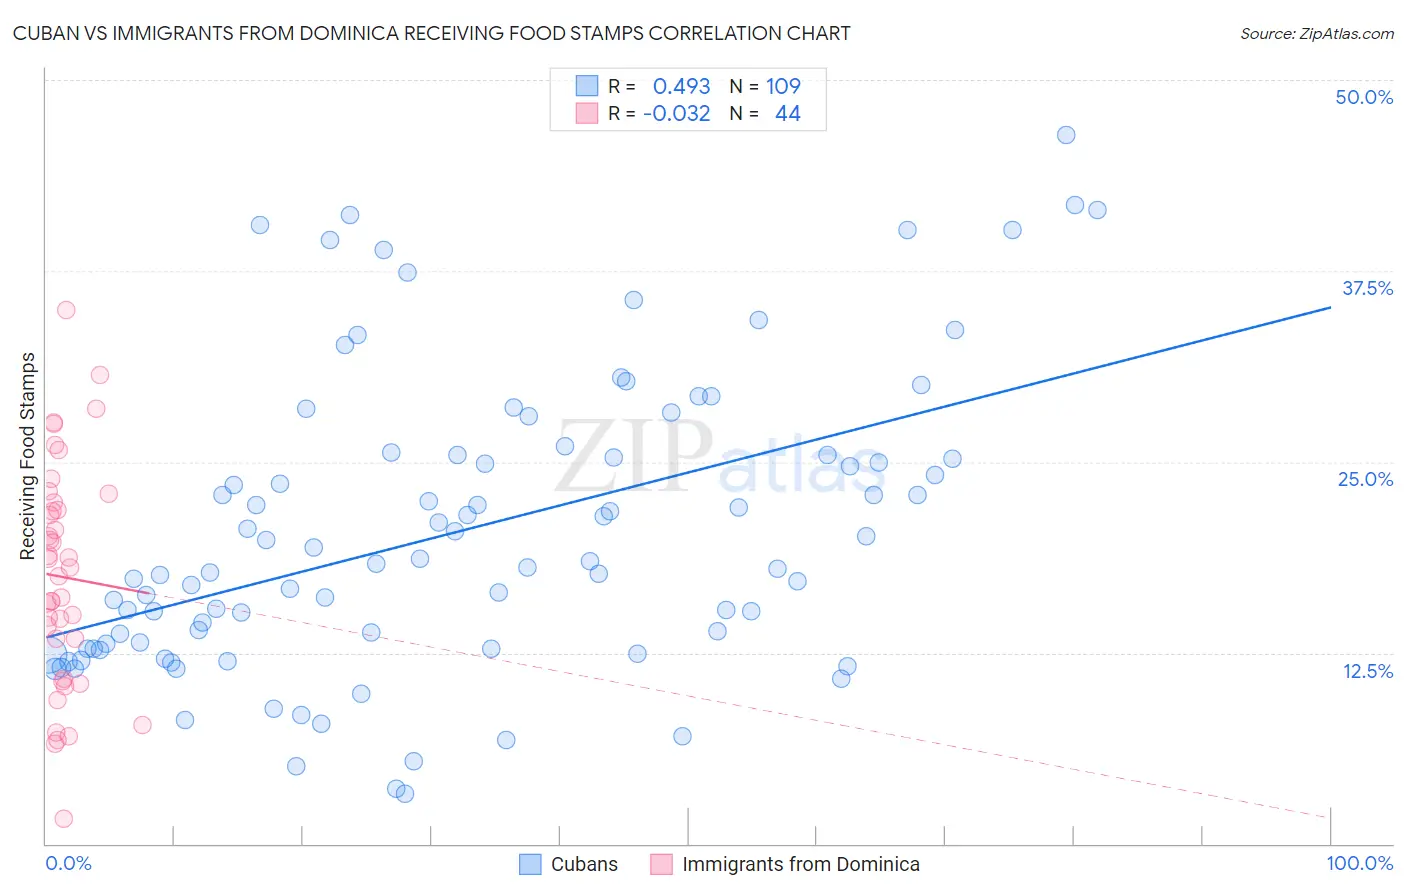
Cuban vs Immigrants from Dominica Receiving Food Stamps Correlation Chart
The statistical analysis conducted on geographies consisting of 447,765,470 people shows a moderate positive correlation between the proportion of Cubans and percentage of population receiving government assistance and/or food stamps in the United States with a correlation coefficient (R) of 0.493 and weighted average of 18.2%. Similarly, the statistical analysis conducted on geographies consisting of 83,761,752 people shows no correlation between the proportion of Immigrants from Dominica and percentage of population receiving government assistance and/or food stamps in the United States with a correlation coefficient (R) of -0.032 and weighted average of 18.4%, a difference of 0.98%.
Receiving Food Stamps Correlation Summary
| Measurement | Cuban | Immigrants from Dominica |
| Minimum | 3.3% | 1.6% |
| Maximum | 46.4% | 35.0% |
| Range | 43.1% | 33.4% |
| Mean | 20.4% | 17.5% |
| Median | 18.3% | 17.8% |
| Interquartile 25% (IQ1) | 12.8% | 12.1% |
| Interquartile 75% (IQ3) | 25.5% | 22.1% |
| Interquartile Range (IQR) | 12.7% | 10.0% |
| Standard Deviation (Sample) | 9.6% | 7.3% |
| Standard Deviation (Population) | 9.6% | 7.2% |
Demographics Similar to Cubans and Immigrants from Dominica by Receiving Food Stamps
In terms of receiving food stamps, the demographic groups most similar to Cubans are Immigrants from Haiti (18.2%, a difference of 0.11%), Apache (18.3%, a difference of 0.31%), Colville (18.3%, a difference of 0.52%), British West Indian (17.9%, a difference of 1.9%), and Immigrants from Grenada (17.8%, a difference of 2.5%). Similarly, the demographic groups most similar to Immigrants from Dominica are Colville (18.3%, a difference of 0.46%), Apache (18.3%, a difference of 0.67%), Immigrants from Haiti (18.2%, a difference of 1.1%), British West Indian (17.9%, a difference of 2.9%), and Pima (19.0%, a difference of 3.0%).
| Demographics | Rating | Rank | Receiving Food Stamps |
| Blacks/African Americans | 0.0 /100 | #317 | Tragic 17.2% |
| Menominee | 0.0 /100 | #318 | Tragic 17.2% |
| Immigrants | St. Vincent and the Grenadines | 0.0 /100 | #319 | Tragic 17.2% |
| Immigrants | Nicaragua | 0.0 /100 | #320 | Tragic 17.2% |
| Natives/Alaskans | 0.0 /100 | #321 | Tragic 17.3% |
| Immigrants | Grenada | 0.0 /100 | #322 | Tragic 17.8% |
| Haitians | 0.0 /100 | #323 | Tragic 17.8% |
| British West Indians | 0.0 /100 | #324 | Tragic 17.9% |
| Immigrants | Haiti | 0.0 /100 | #325 | Tragic 18.2% |
| Cubans | 0.0 /100 | #326 | Tragic 18.2% |
| Apache | 0.0 /100 | #327 | Tragic 18.3% |
| Colville | 0.0 /100 | #328 | Tragic 18.3% |
| Immigrants | Dominica | 0.0 /100 | #329 | Tragic 18.4% |
| Pima | 0.0 /100 | #330 | Tragic 19.0% |
| Immigrants | Caribbean | 0.0 /100 | #331 | Tragic 19.6% |
| Pueblo | 0.0 /100 | #332 | Tragic 19.9% |
| Inupiat | 0.0 /100 | #333 | Tragic 20.1% |
| Yuman | 0.0 /100 | #334 | Tragic 20.2% |
| Immigrants | Cuba | 0.0 /100 | #335 | Tragic 20.8% |
| Navajo | 0.0 /100 | #336 | Tragic 21.1% |
| Cape Verdeans | 0.0 /100 | #337 | Tragic 21.1% |