Cuban vs Immigrants from Europe Receiving Food Stamps
COMPARE
Cuban
Immigrants from Europe
Receiving Food Stamps
Receiving Food Stamps Comparison
Cubans
Immigrants from Europe
18.2%
RECEIVING FOOD STAMPS
0.0/ 100
METRIC RATING
326th/ 347
METRIC RANK
10.3%
RECEIVING FOOD STAMPS
96.8/ 100
METRIC RATING
102nd/ 347
METRIC RANK
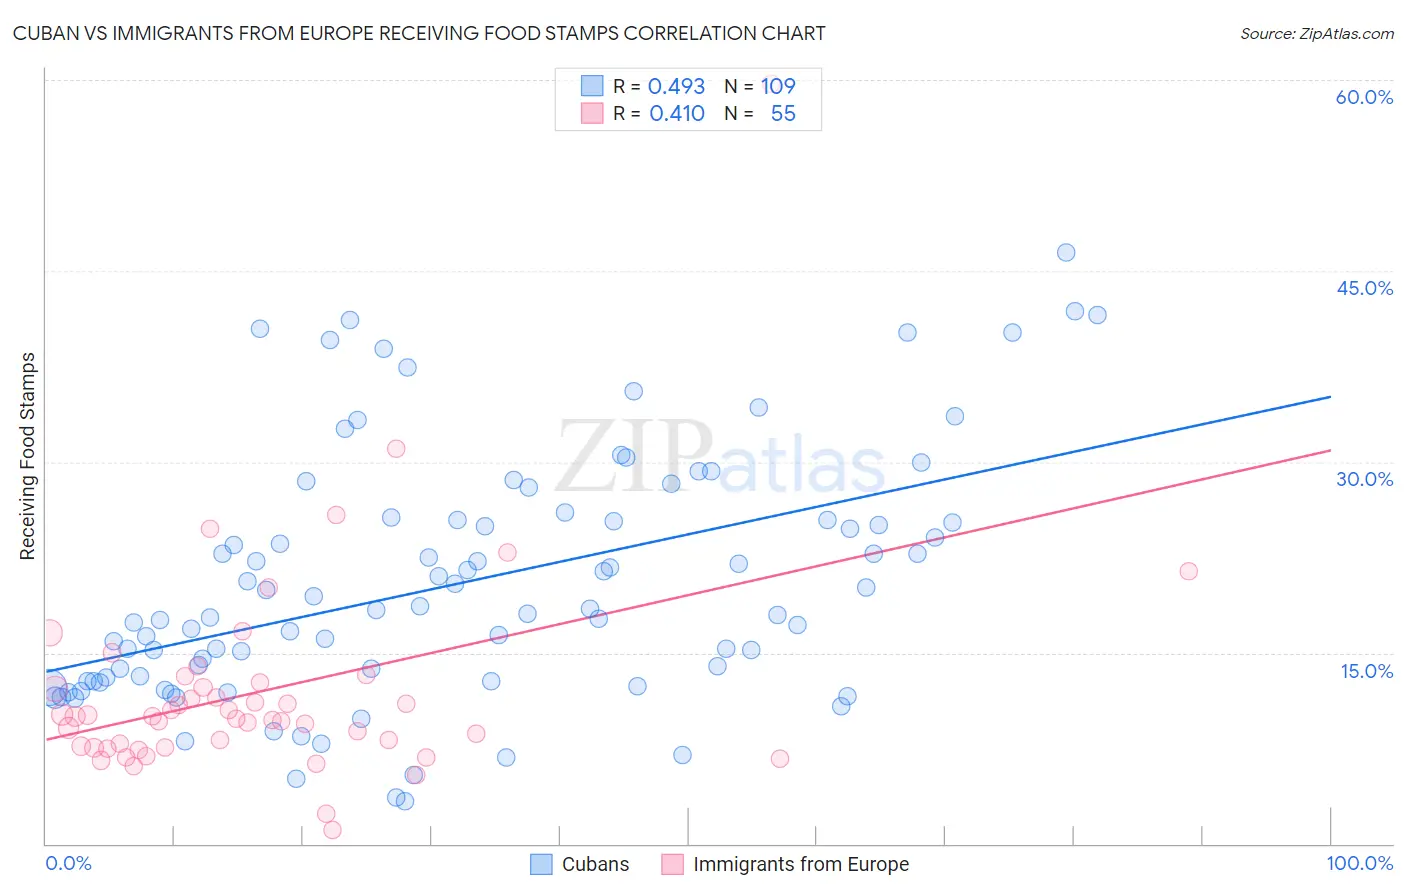
Cuban vs Immigrants from Europe Receiving Food Stamps Correlation Chart
The statistical analysis conducted on geographies consisting of 447,765,470 people shows a moderate positive correlation between the proportion of Cubans and percentage of population receiving government assistance and/or food stamps in the United States with a correlation coefficient (R) of 0.493 and weighted average of 18.2%. Similarly, the statistical analysis conducted on geographies consisting of 544,262,616 people shows a moderate positive correlation between the proportion of Immigrants from Europe and percentage of population receiving government assistance and/or food stamps in the United States with a correlation coefficient (R) of 0.410 and weighted average of 10.3%, a difference of 76.4%.
Receiving Food Stamps Correlation Summary
| Measurement | Cuban | Immigrants from Europe |
| Minimum | 3.3% | 1.1% |
| Maximum | 46.4% | 59.7% |
| Range | 43.1% | 58.6% |
| Mean | 20.4% | 12.0% |
| Median | 18.3% | 10.0% |
| Interquartile 25% (IQ1) | 12.8% | 7.6% |
| Interquartile 75% (IQ3) | 25.5% | 12.7% |
| Interquartile Range (IQR) | 12.7% | 5.1% |
| Standard Deviation (Sample) | 9.6% | 8.6% |
| Standard Deviation (Population) | 9.6% | 8.5% |
Similar Demographics by Receiving Food Stamps
Demographics Similar to Cubans by Receiving Food Stamps
In terms of receiving food stamps, the demographic groups most similar to Cubans are Immigrants from Haiti (18.2%, a difference of 0.11%), Apache (18.3%, a difference of 0.31%), Colville (18.3%, a difference of 0.52%), Immigrants from Dominica (18.4%, a difference of 0.98%), and British West Indian (17.9%, a difference of 1.9%).
| Demographics | Rating | Rank | Receiving Food Stamps |
| Immigrants | St. Vincent and the Grenadines | 0.0 /100 | #319 | Tragic 17.2% |
| Immigrants | Nicaragua | 0.0 /100 | #320 | Tragic 17.2% |
| Natives/Alaskans | 0.0 /100 | #321 | Tragic 17.3% |
| Immigrants | Grenada | 0.0 /100 | #322 | Tragic 17.8% |
| Haitians | 0.0 /100 | #323 | Tragic 17.8% |
| British West Indians | 0.0 /100 | #324 | Tragic 17.9% |
| Immigrants | Haiti | 0.0 /100 | #325 | Tragic 18.2% |
| Cubans | 0.0 /100 | #326 | Tragic 18.2% |
| Apache | 0.0 /100 | #327 | Tragic 18.3% |
| Colville | 0.0 /100 | #328 | Tragic 18.3% |
| Immigrants | Dominica | 0.0 /100 | #329 | Tragic 18.4% |
| Pima | 0.0 /100 | #330 | Tragic 19.0% |
| Immigrants | Caribbean | 0.0 /100 | #331 | Tragic 19.6% |
| Pueblo | 0.0 /100 | #332 | Tragic 19.9% |
| Inupiat | 0.0 /100 | #333 | Tragic 20.1% |
Demographics Similar to Immigrants from Europe by Receiving Food Stamps
In terms of receiving food stamps, the demographic groups most similar to Immigrants from Europe are Immigrants from Western Europe (10.3%, a difference of 0.090%), Palestinian (10.3%, a difference of 0.090%), Immigrants from Latvia (10.3%, a difference of 0.10%), Immigrants from Hungary (10.3%, a difference of 0.11%), and Serbian (10.3%, a difference of 0.21%).
| Demographics | Rating | Rank | Receiving Food Stamps |
| Basques | 97.4 /100 | #95 | Exceptional 10.3% |
| Welsh | 97.3 /100 | #96 | Exceptional 10.3% |
| Czechoslovakians | 97.2 /100 | #97 | Exceptional 10.3% |
| Immigrants | Egypt | 97.1 /100 | #98 | Exceptional 10.3% |
| Serbians | 97.0 /100 | #99 | Exceptional 10.3% |
| Immigrants | Western Europe | 96.9 /100 | #100 | Exceptional 10.3% |
| Palestinians | 96.9 /100 | #101 | Exceptional 10.3% |
| Immigrants | Europe | 96.8 /100 | #102 | Exceptional 10.3% |
| Immigrants | Latvia | 96.8 /100 | #103 | Exceptional 10.3% |
| Immigrants | Hungary | 96.7 /100 | #104 | Exceptional 10.3% |
| Immigrants | Malaysia | 96.5 /100 | #105 | Exceptional 10.4% |
| Immigrants | Italy | 96.4 /100 | #106 | Exceptional 10.4% |
| Koreans | 96.3 /100 | #107 | Exceptional 10.4% |
| Carpatho Rusyns | 96.2 /100 | #108 | Exceptional 10.4% |
| Immigrants | Pakistan | 96.2 /100 | #109 | Exceptional 10.4% |