Cambodian vs Immigrants from Scotland Single Mother Poverty
COMPARE
Cambodian
Immigrants from Scotland
Single Mother Poverty
Single Mother Poverty Comparison
Cambodians
Immigrants from Scotland
27.0%
SINGLE MOTHER POVERTY
99.8/ 100
METRIC RATING
49th/ 347
METRIC RANK
27.6%
SINGLE MOTHER POVERTY
98.9/ 100
METRIC RATING
81st/ 347
METRIC RANK
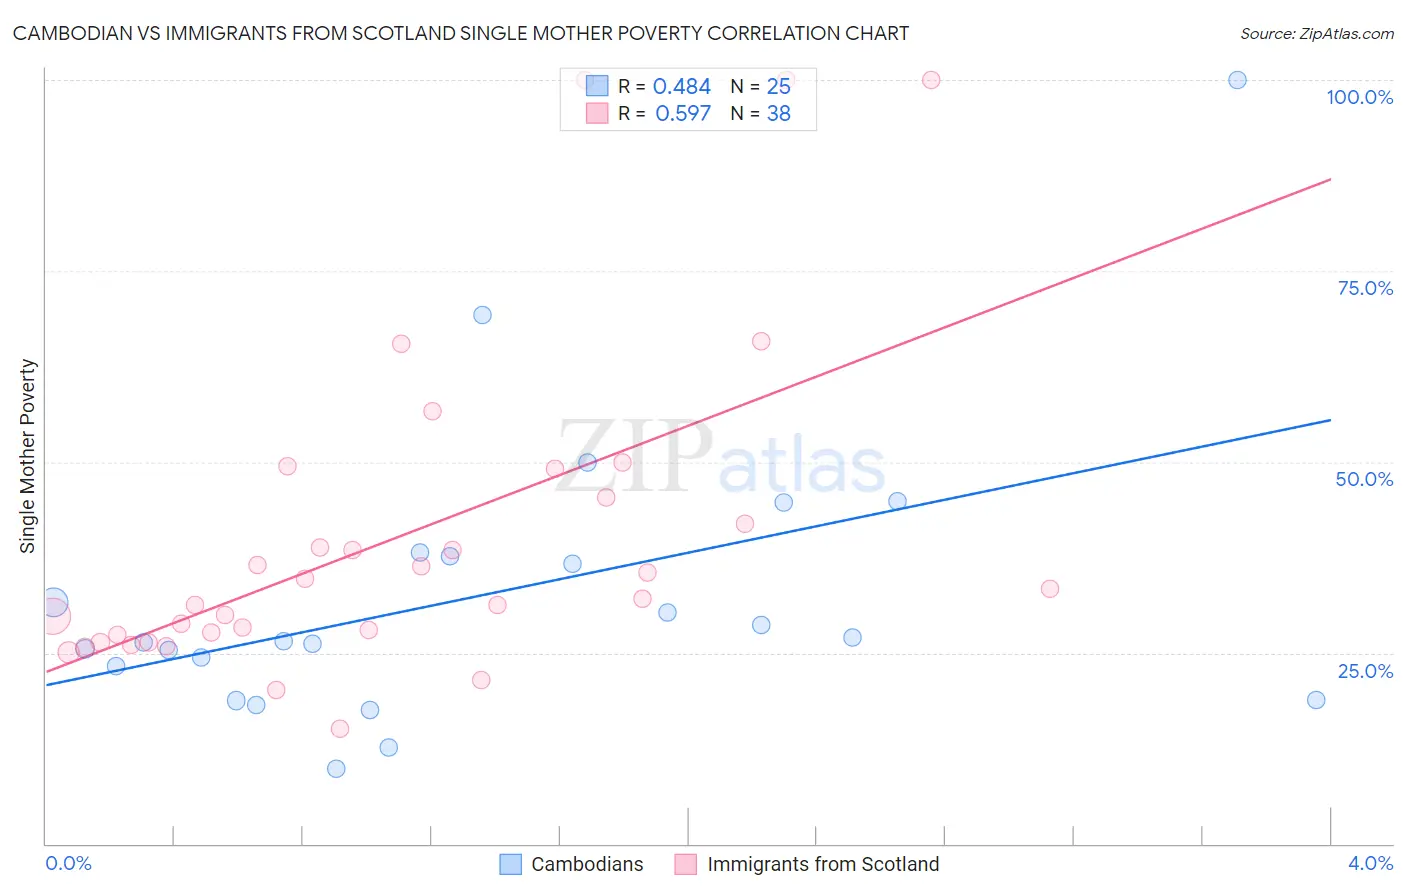
Cambodian vs Immigrants from Scotland Single Mother Poverty Correlation Chart
The statistical analysis conducted on geographies consisting of 101,772,823 people shows a moderate positive correlation between the proportion of Cambodians and poverty level among single mothers in the United States with a correlation coefficient (R) of 0.484 and weighted average of 27.0%. Similarly, the statistical analysis conducted on geographies consisting of 192,448,213 people shows a substantial positive correlation between the proportion of Immigrants from Scotland and poverty level among single mothers in the United States with a correlation coefficient (R) of 0.597 and weighted average of 27.6%, a difference of 2.4%.
Single Mother Poverty Correlation Summary
| Measurement | Cambodian | Immigrants from Scotland |
| Minimum | 9.8% | 15.0% |
| Maximum | 100.0% | 100.0% |
| Range | 90.2% | 85.0% |
| Mean | 32.5% | 40.1% |
| Median | 26.5% | 32.7% |
| Interquartile 25% (IQ1) | 21.0% | 27.4% |
| Interquartile 75% (IQ3) | 37.8% | 45.3% |
| Interquartile Range (IQR) | 16.8% | 17.9% |
| Standard Deviation (Sample) | 19.1% | 21.1% |
| Standard Deviation (Population) | 18.7% | 20.8% |
Similar Demographics by Single Mother Poverty
Demographics Similar to Cambodians by Single Mother Poverty
In terms of single mother poverty, the demographic groups most similar to Cambodians are Laotian (27.0%, a difference of 0.010%), Immigrants from Poland (26.9%, a difference of 0.080%), Egyptian (26.9%, a difference of 0.16%), Immigrants from Serbia (26.9%, a difference of 0.22%), and Latvian (26.9%, a difference of 0.26%).
| Demographics | Rating | Rank | Single Mother Poverty |
| Armenians | 99.9 /100 | #42 | Exceptional 26.8% |
| Tsimshian | 99.9 /100 | #43 | Exceptional 26.8% |
| Immigrants | Sierra Leone | 99.9 /100 | #44 | Exceptional 26.9% |
| Latvians | 99.9 /100 | #45 | Exceptional 26.9% |
| Immigrants | Serbia | 99.9 /100 | #46 | Exceptional 26.9% |
| Egyptians | 99.8 /100 | #47 | Exceptional 26.9% |
| Immigrants | Poland | 99.8 /100 | #48 | Exceptional 26.9% |
| Cambodians | 99.8 /100 | #49 | Exceptional 27.0% |
| Laotians | 99.8 /100 | #50 | Exceptional 27.0% |
| Immigrants | Argentina | 99.7 /100 | #51 | Exceptional 27.1% |
| Immigrants | South Eastern Asia | 99.7 /100 | #52 | Exceptional 27.1% |
| Immigrants | Jordan | 99.7 /100 | #53 | Exceptional 27.1% |
| Immigrants | Bulgaria | 99.7 /100 | #54 | Exceptional 27.1% |
| Immigrants | Egypt | 99.7 /100 | #55 | Exceptional 27.1% |
| Immigrants | Romania | 99.7 /100 | #56 | Exceptional 27.2% |
Demographics Similar to Immigrants from Scotland by Single Mother Poverty
In terms of single mother poverty, the demographic groups most similar to Immigrants from Scotland are Immigrants from Cameroon (27.6%, a difference of 0.12%), Greek (27.7%, a difference of 0.18%), Immigrants from Latvia (27.7%, a difference of 0.21%), Mongolian (27.7%, a difference of 0.21%), and Immigrants from Ukraine (27.7%, a difference of 0.30%).
| Demographics | Rating | Rank | Single Mother Poverty |
| Immigrants | Europe | 99.3 /100 | #74 | Exceptional 27.4% |
| Immigrants | Sweden | 99.2 /100 | #75 | Exceptional 27.5% |
| Peruvians | 99.2 /100 | #76 | Exceptional 27.5% |
| Immigrants | Peru | 99.2 /100 | #77 | Exceptional 27.5% |
| Immigrants | North Macedonia | 99.2 /100 | #78 | Exceptional 27.5% |
| Immigrants | Italy | 99.1 /100 | #79 | Exceptional 27.5% |
| Taiwanese | 99.1 /100 | #80 | Exceptional 27.5% |
| Immigrants | Scotland | 98.9 /100 | #81 | Exceptional 27.6% |
| Immigrants | Cameroon | 98.8 /100 | #82 | Exceptional 27.6% |
| Greeks | 98.7 /100 | #83 | Exceptional 27.7% |
| Immigrants | Latvia | 98.7 /100 | #84 | Exceptional 27.7% |
| Mongolians | 98.7 /100 | #85 | Exceptional 27.7% |
| Immigrants | Ukraine | 98.6 /100 | #86 | Exceptional 27.7% |
| Afghans | 98.5 /100 | #87 | Exceptional 27.7% |
| Ethiopians | 98.4 /100 | #88 | Exceptional 27.7% |