Vietnamese vs Immigrants from Scotland Single Mother Poverty
COMPARE
Vietnamese
Immigrants from Scotland
Single Mother Poverty
Single Mother Poverty Comparison
Vietnamese
Immigrants from Scotland
30.9%
SINGLE MOTHER POVERTY
0.7/ 100
METRIC RATING
250th/ 347
METRIC RANK
27.6%
SINGLE MOTHER POVERTY
98.9/ 100
METRIC RATING
81st/ 347
METRIC RANK
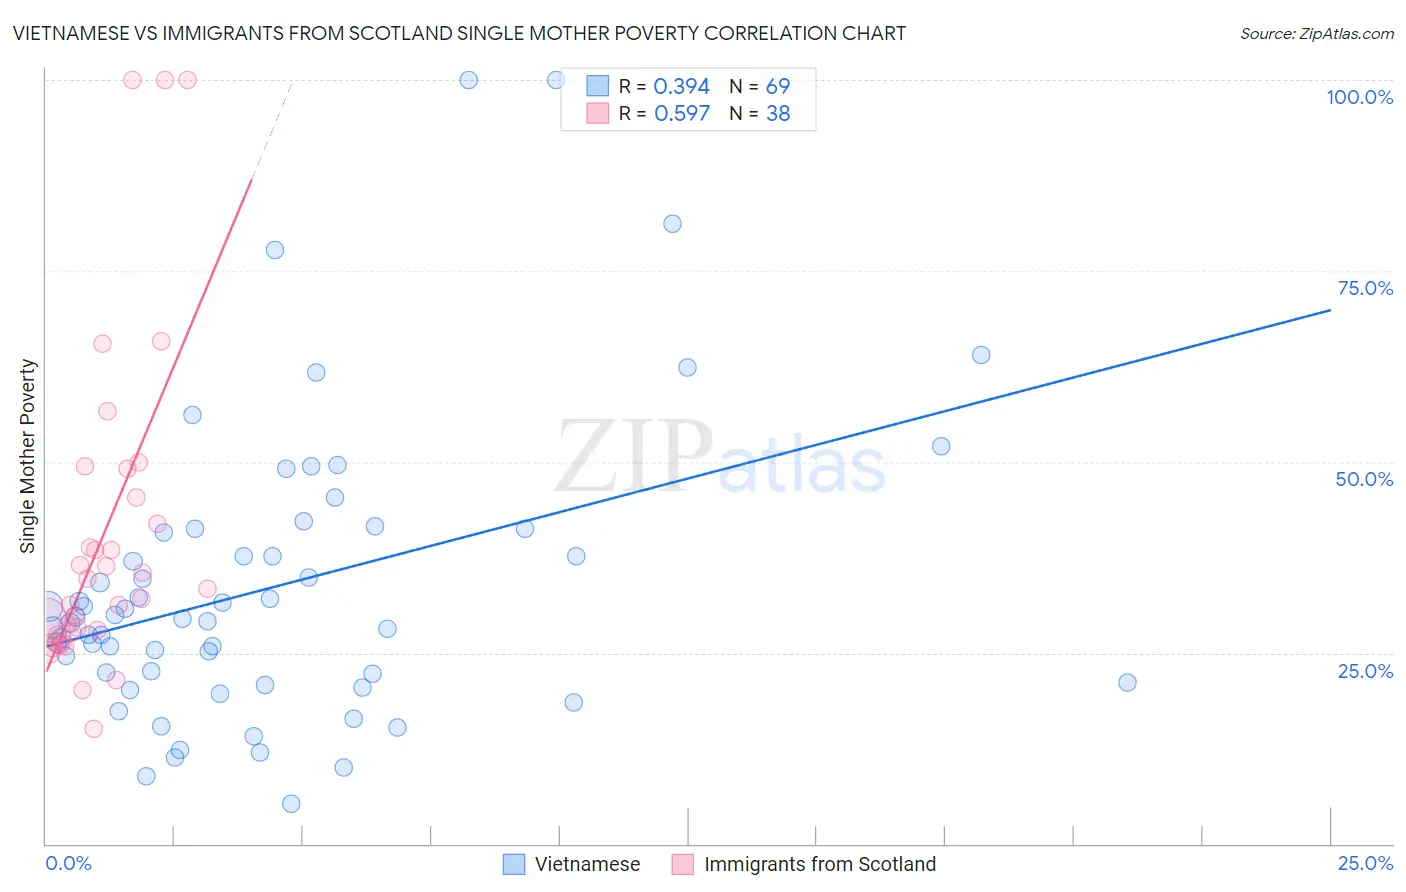
Vietnamese vs Immigrants from Scotland Single Mother Poverty Correlation Chart
The statistical analysis conducted on geographies consisting of 168,932,056 people shows a mild positive correlation between the proportion of Vietnamese and poverty level among single mothers in the United States with a correlation coefficient (R) of 0.394 and weighted average of 30.9%. Similarly, the statistical analysis conducted on geographies consisting of 192,448,213 people shows a substantial positive correlation between the proportion of Immigrants from Scotland and poverty level among single mothers in the United States with a correlation coefficient (R) of 0.597 and weighted average of 27.6%, a difference of 11.9%.
Single Mother Poverty Correlation Summary
| Measurement | Vietnamese | Immigrants from Scotland |
| Minimum | 5.3% | 15.0% |
| Maximum | 100.0% | 100.0% |
| Range | 94.7% | 85.0% |
| Mean | 33.6% | 40.1% |
| Median | 29.4% | 32.7% |
| Interquartile 25% (IQ1) | 21.7% | 27.4% |
| Interquartile 75% (IQ3) | 41.0% | 45.3% |
| Interquartile Range (IQR) | 19.2% | 17.9% |
| Standard Deviation (Sample) | 19.1% | 21.1% |
| Standard Deviation (Population) | 19.0% | 20.8% |
Similar Demographics by Single Mother Poverty
Demographics Similar to Vietnamese by Single Mother Poverty
In terms of single mother poverty, the demographic groups most similar to Vietnamese are Tlingit-Haida (30.9%, a difference of 0.12%), Alaska Native (30.9%, a difference of 0.13%), Cape Verdean (30.8%, a difference of 0.15%), Celtic (30.9%, a difference of 0.16%), and French Canadian (30.8%, a difference of 0.22%).
| Demographics | Rating | Rank | Single Mother Poverty |
| Bermudans | 1.6 /100 | #243 | Tragic 30.6% |
| French | 1.3 /100 | #244 | Tragic 30.7% |
| Barbadians | 1.3 /100 | #245 | Tragic 30.7% |
| Ecuadorians | 0.9 /100 | #246 | Tragic 30.8% |
| West Indians | 0.9 /100 | #247 | Tragic 30.8% |
| French Canadians | 0.9 /100 | #248 | Tragic 30.8% |
| Cape Verdeans | 0.8 /100 | #249 | Tragic 30.8% |
| Vietnamese | 0.7 /100 | #250 | Tragic 30.9% |
| Tlingit-Haida | 0.6 /100 | #251 | Tragic 30.9% |
| Alaska Natives | 0.6 /100 | #252 | Tragic 30.9% |
| Celtics | 0.6 /100 | #253 | Tragic 30.9% |
| Senegalese | 0.5 /100 | #254 | Tragic 31.0% |
| Belizeans | 0.5 /100 | #255 | Tragic 31.0% |
| Immigrants | West Indies | 0.4 /100 | #256 | Tragic 31.1% |
| Immigrants | Bahamas | 0.4 /100 | #257 | Tragic 31.1% |
Demographics Similar to Immigrants from Scotland by Single Mother Poverty
In terms of single mother poverty, the demographic groups most similar to Immigrants from Scotland are Immigrants from Cameroon (27.6%, a difference of 0.12%), Greek (27.7%, a difference of 0.18%), Immigrants from Latvia (27.7%, a difference of 0.21%), Mongolian (27.7%, a difference of 0.21%), and Immigrants from Ukraine (27.7%, a difference of 0.30%).
| Demographics | Rating | Rank | Single Mother Poverty |
| Immigrants | Europe | 99.3 /100 | #74 | Exceptional 27.4% |
| Immigrants | Sweden | 99.2 /100 | #75 | Exceptional 27.5% |
| Peruvians | 99.2 /100 | #76 | Exceptional 27.5% |
| Immigrants | Peru | 99.2 /100 | #77 | Exceptional 27.5% |
| Immigrants | North Macedonia | 99.2 /100 | #78 | Exceptional 27.5% |
| Immigrants | Italy | 99.1 /100 | #79 | Exceptional 27.5% |
| Taiwanese | 99.1 /100 | #80 | Exceptional 27.5% |
| Immigrants | Scotland | 98.9 /100 | #81 | Exceptional 27.6% |
| Immigrants | Cameroon | 98.8 /100 | #82 | Exceptional 27.6% |
| Greeks | 98.7 /100 | #83 | Exceptional 27.7% |
| Immigrants | Latvia | 98.7 /100 | #84 | Exceptional 27.7% |
| Mongolians | 98.7 /100 | #85 | Exceptional 27.7% |
| Immigrants | Ukraine | 98.6 /100 | #86 | Exceptional 27.7% |
| Afghans | 98.5 /100 | #87 | Exceptional 27.7% |
| Ethiopians | 98.4 /100 | #88 | Exceptional 27.7% |