Croatian vs Immigrants from Scotland In Labor Force | Age 20-64
COMPARE
Croatian
Immigrants from Scotland
In Labor Force | Age 20-64
In Labor Force | Age 20-64 Comparison
Croatians
Immigrants from Scotland
80.1%
IN LABOR FORCE | AGE 20-64
97.1/ 100
METRIC RATING
87th/ 347
METRIC RANK
79.6%
IN LABOR FORCE | AGE 20-64
52.4/ 100
METRIC RATING
173rd/ 347
METRIC RANK
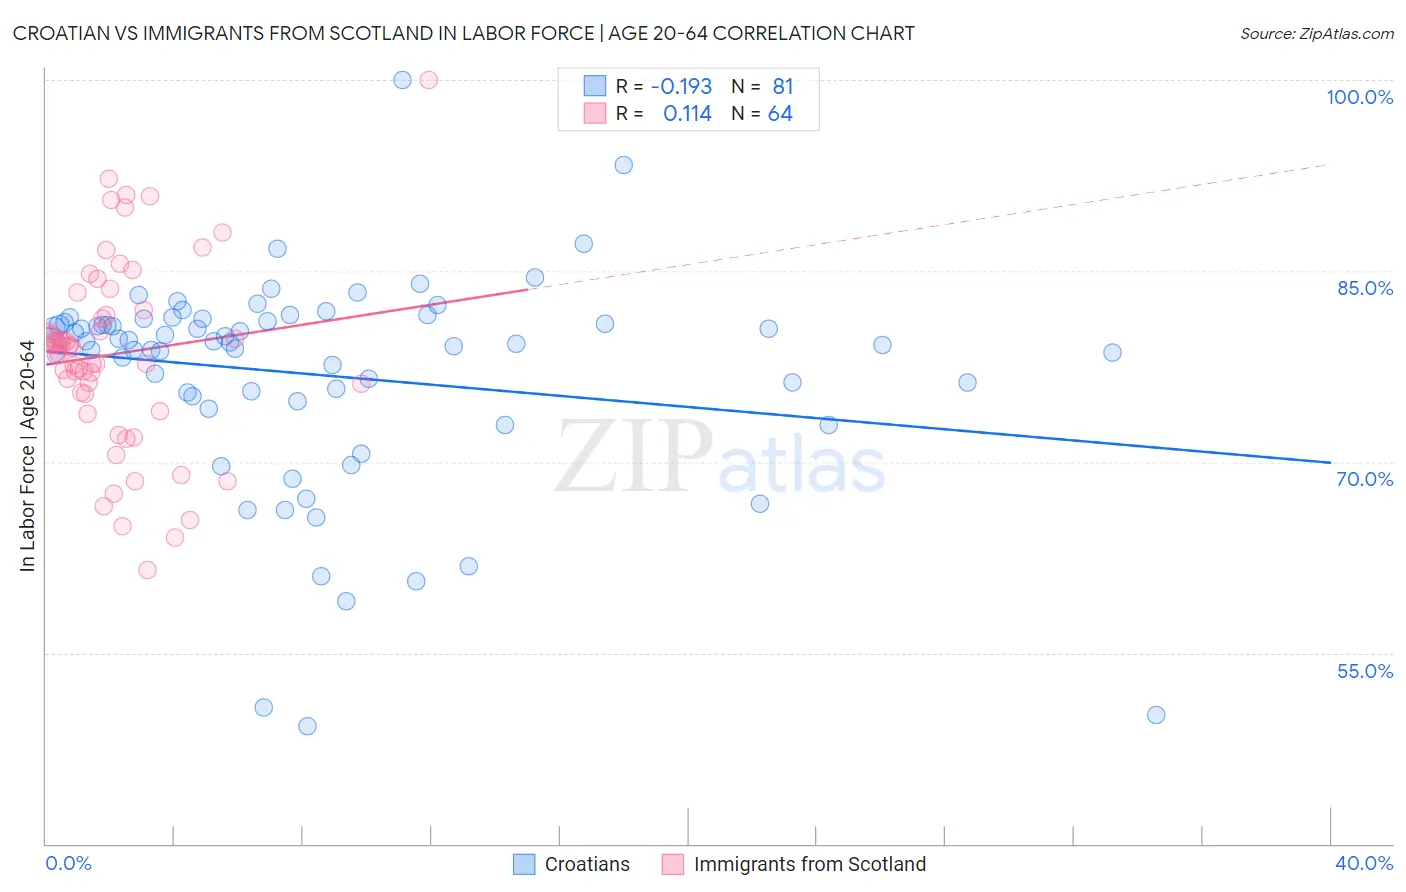
Croatian vs Immigrants from Scotland In Labor Force | Age 20-64 Correlation Chart
The statistical analysis conducted on geographies consisting of 375,744,392 people shows a poor negative correlation between the proportion of Croatians and labor force participation rate among population between the ages 20 and 64 in the United States with a correlation coefficient (R) of -0.193 and weighted average of 80.1%. Similarly, the statistical analysis conducted on geographies consisting of 196,399,264 people shows a poor positive correlation between the proportion of Immigrants from Scotland and labor force participation rate among population between the ages 20 and 64 in the United States with a correlation coefficient (R) of 0.114 and weighted average of 79.6%, a difference of 0.69%.
In Labor Force | Age 20-64 Correlation Summary
| Measurement | Croatian | Immigrants from Scotland |
| Minimum | 49.3% | 61.5% |
| Maximum | 100.0% | 100.0% |
| Range | 50.7% | 38.5% |
| Mean | 76.8% | 78.5% |
| Median | 79.4% | 79.0% |
| Interquartile 25% (IQ1) | 75.0% | 75.4% |
| Interquartile 75% (IQ3) | 81.1% | 81.7% |
| Interquartile Range (IQR) | 6.2% | 6.3% |
| Standard Deviation (Sample) | 8.5% | 7.4% |
| Standard Deviation (Population) | 8.5% | 7.3% |
Similar Demographics by In Labor Force | Age 20-64
Demographics Similar to Croatians by In Labor Force | Age 20-64
In terms of in labor force | age 20-64, the demographic groups most similar to Croatians are Jordanian (80.1%, a difference of 0.0%), Immigrants from Egypt (80.1%, a difference of 0.0%), Immigrants from Japan (80.1%, a difference of 0.010%), Colombian (80.1%, a difference of 0.010%), and Immigrants from Latvia (80.1%, a difference of 0.010%).
| Demographics | Rating | Rank | In Labor Force | Age 20-64 |
| Immigrants | Croatia | 97.6 /100 | #80 | Exceptional 80.1% |
| German Russians | 97.3 /100 | #81 | Exceptional 80.1% |
| Immigrants | Japan | 97.3 /100 | #82 | Exceptional 80.1% |
| Colombians | 97.3 /100 | #83 | Exceptional 80.1% |
| Immigrants | Latvia | 97.2 /100 | #84 | Exceptional 80.1% |
| Jordanians | 97.2 /100 | #85 | Exceptional 80.1% |
| Immigrants | Egypt | 97.1 /100 | #86 | Exceptional 80.1% |
| Croatians | 97.1 /100 | #87 | Exceptional 80.1% |
| Chileans | 97.0 /100 | #88 | Exceptional 80.1% |
| Immigrants | Venezuela | 96.8 /100 | #89 | Exceptional 80.1% |
| Poles | 96.8 /100 | #90 | Exceptional 80.1% |
| Uruguayans | 96.7 /100 | #91 | Exceptional 80.1% |
| Ghanaians | 96.7 /100 | #92 | Exceptional 80.1% |
| Immigrants | Belarus | 96.4 /100 | #93 | Exceptional 80.1% |
| Immigrants | Asia | 96.0 /100 | #94 | Exceptional 80.1% |
Demographics Similar to Immigrants from Scotland by In Labor Force | Age 20-64
In terms of in labor force | age 20-64, the demographic groups most similar to Immigrants from Scotland are Slavic (79.6%, a difference of 0.010%), Immigrants from Switzerland (79.6%, a difference of 0.010%), Immigrants from Belgium (79.6%, a difference of 0.010%), Syrian (79.6%, a difference of 0.020%), and Laotian (79.6%, a difference of 0.050%).
| Demographics | Rating | Rank | In Labor Force | Age 20-64 |
| Okinawans | 62.7 /100 | #166 | Good 79.6% |
| Immigrants | Iraq | 62.0 /100 | #167 | Good 79.6% |
| Immigrants | Indonesia | 61.8 /100 | #168 | Good 79.6% |
| Laotians | 58.4 /100 | #169 | Average 79.6% |
| Slavs | 54.0 /100 | #170 | Average 79.6% |
| Immigrants | Switzerland | 53.3 /100 | #171 | Average 79.6% |
| Immigrants | Belgium | 53.1 /100 | #172 | Average 79.6% |
| Immigrants | Scotland | 52.4 /100 | #173 | Average 79.6% |
| Syrians | 50.0 /100 | #174 | Average 79.6% |
| Cubans | 46.1 /100 | #175 | Average 79.5% |
| Australians | 46.0 /100 | #176 | Average 79.5% |
| Immigrants | Netherlands | 45.2 /100 | #177 | Average 79.5% |
| Czechoslovakians | 44.3 /100 | #178 | Average 79.5% |
| Armenians | 41.4 /100 | #179 | Average 79.5% |
| Salvadorans | 41.0 /100 | #180 | Average 79.5% |