Immigrants from Latin America vs Immigrants from Scotland Single Mother Poverty
COMPARE
Immigrants from Latin America
Immigrants from Scotland
Single Mother Poverty
Single Mother Poverty Comparison
Immigrants from Latin America
Immigrants from Scotland
32.4%
SINGLE MOTHER POVERTY
0.0/ 100
METRIC RATING
285th/ 347
METRIC RANK
27.6%
SINGLE MOTHER POVERTY
98.9/ 100
METRIC RATING
81st/ 347
METRIC RANK
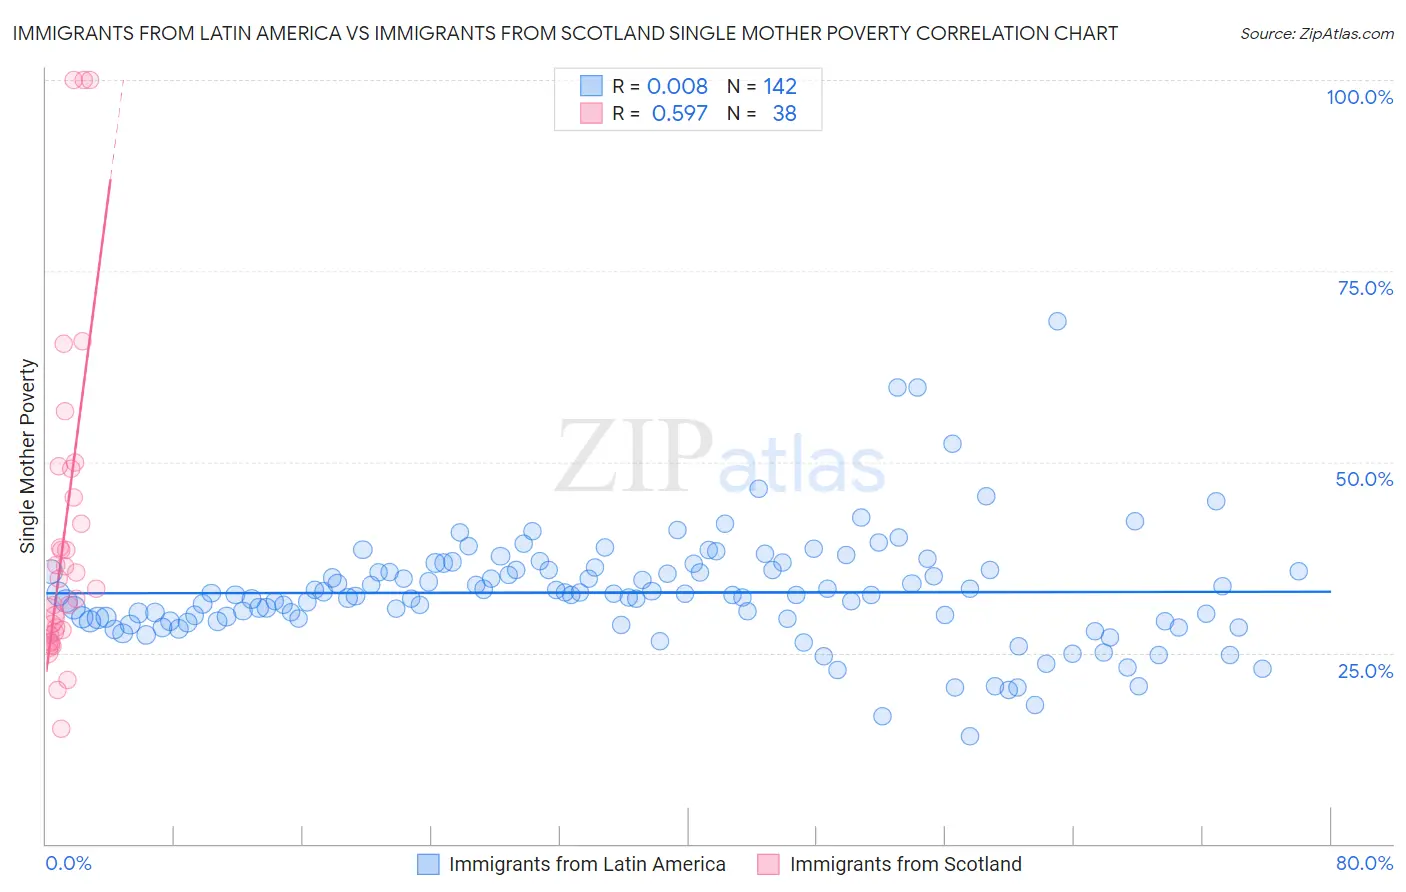
Immigrants from Latin America vs Immigrants from Scotland Single Mother Poverty Correlation Chart
The statistical analysis conducted on geographies consisting of 534,740,135 people shows no correlation between the proportion of Immigrants from Latin America and poverty level among single mothers in the United States with a correlation coefficient (R) of 0.008 and weighted average of 32.4%. Similarly, the statistical analysis conducted on geographies consisting of 192,448,213 people shows a substantial positive correlation between the proportion of Immigrants from Scotland and poverty level among single mothers in the United States with a correlation coefficient (R) of 0.597 and weighted average of 27.6%, a difference of 17.5%.
Single Mother Poverty Correlation Summary
| Measurement | Immigrants from Latin America | Immigrants from Scotland |
| Minimum | 14.1% | 15.0% |
| Maximum | 68.5% | 100.0% |
| Range | 54.3% | 85.0% |
| Mean | 32.9% | 40.1% |
| Median | 32.6% | 32.7% |
| Interquartile 25% (IQ1) | 29.2% | 27.4% |
| Interquartile 75% (IQ3) | 35.8% | 45.3% |
| Interquartile Range (IQR) | 6.6% | 17.9% |
| Standard Deviation (Sample) | 7.3% | 21.1% |
| Standard Deviation (Population) | 7.3% | 20.8% |
Similar Demographics by Single Mother Poverty
Demographics Similar to Immigrants from Latin America by Single Mother Poverty
In terms of single mother poverty, the demographic groups most similar to Immigrants from Latin America are Yup'ik (32.5%, a difference of 0.070%), Indonesian (32.4%, a difference of 0.11%), Immigrants from Dominica (32.5%, a difference of 0.20%), Spanish American (32.3%, a difference of 0.41%), and Somali (32.6%, a difference of 0.43%).
| Demographics | Rating | Rank | Single Mother Poverty |
| Immigrants | Zaire | 0.0 /100 | #278 | Tragic 32.0% |
| Marshallese | 0.0 /100 | #279 | Tragic 32.1% |
| Immigrants | Nonimmigrants | 0.0 /100 | #280 | Tragic 32.2% |
| Cree | 0.0 /100 | #281 | Tragic 32.2% |
| Immigrants | Azores | 0.0 /100 | #282 | Tragic 32.2% |
| Spanish Americans | 0.0 /100 | #283 | Tragic 32.3% |
| Indonesians | 0.0 /100 | #284 | Tragic 32.4% |
| Immigrants | Latin America | 0.0 /100 | #285 | Tragic 32.4% |
| Yup'ik | 0.0 /100 | #286 | Tragic 32.5% |
| Immigrants | Dominica | 0.0 /100 | #287 | Tragic 32.5% |
| Somalis | 0.0 /100 | #288 | Tragic 32.6% |
| U.S. Virgin Islanders | 0.0 /100 | #289 | Tragic 32.6% |
| Osage | 0.0 /100 | #290 | Tragic 32.6% |
| Guatemalans | 0.0 /100 | #291 | Tragic 32.9% |
| Shoshone | 0.0 /100 | #292 | Tragic 32.9% |
Demographics Similar to Immigrants from Scotland by Single Mother Poverty
In terms of single mother poverty, the demographic groups most similar to Immigrants from Scotland are Immigrants from Cameroon (27.6%, a difference of 0.12%), Greek (27.7%, a difference of 0.18%), Immigrants from Latvia (27.7%, a difference of 0.21%), Mongolian (27.7%, a difference of 0.21%), and Immigrants from Ukraine (27.7%, a difference of 0.30%).
| Demographics | Rating | Rank | Single Mother Poverty |
| Immigrants | Europe | 99.3 /100 | #74 | Exceptional 27.4% |
| Immigrants | Sweden | 99.2 /100 | #75 | Exceptional 27.5% |
| Peruvians | 99.2 /100 | #76 | Exceptional 27.5% |
| Immigrants | Peru | 99.2 /100 | #77 | Exceptional 27.5% |
| Immigrants | North Macedonia | 99.2 /100 | #78 | Exceptional 27.5% |
| Immigrants | Italy | 99.1 /100 | #79 | Exceptional 27.5% |
| Taiwanese | 99.1 /100 | #80 | Exceptional 27.5% |
| Immigrants | Scotland | 98.9 /100 | #81 | Exceptional 27.6% |
| Immigrants | Cameroon | 98.8 /100 | #82 | Exceptional 27.6% |
| Greeks | 98.7 /100 | #83 | Exceptional 27.7% |
| Immigrants | Latvia | 98.7 /100 | #84 | Exceptional 27.7% |
| Mongolians | 98.7 /100 | #85 | Exceptional 27.7% |
| Immigrants | Ukraine | 98.6 /100 | #86 | Exceptional 27.7% |
| Afghans | 98.5 /100 | #87 | Exceptional 27.7% |
| Ethiopians | 98.4 /100 | #88 | Exceptional 27.7% |