Croatian vs Immigrants from Armenia Married-Couple Family Poverty
COMPARE
Croatian
Immigrants from Armenia
Married-Couple Family Poverty
Married-Couple Family Poverty Comparison
Croatians
Immigrants from Armenia
3.9%
MARRIED-COUPLE FAMILY POVERTY
100.0/ 100
METRIC RATING
9th/ 347
METRIC RANK
7.1%
MARRIED-COUPLE FAMILY POVERTY
0.0/ 100
METRIC RATING
312th/ 347
METRIC RANK
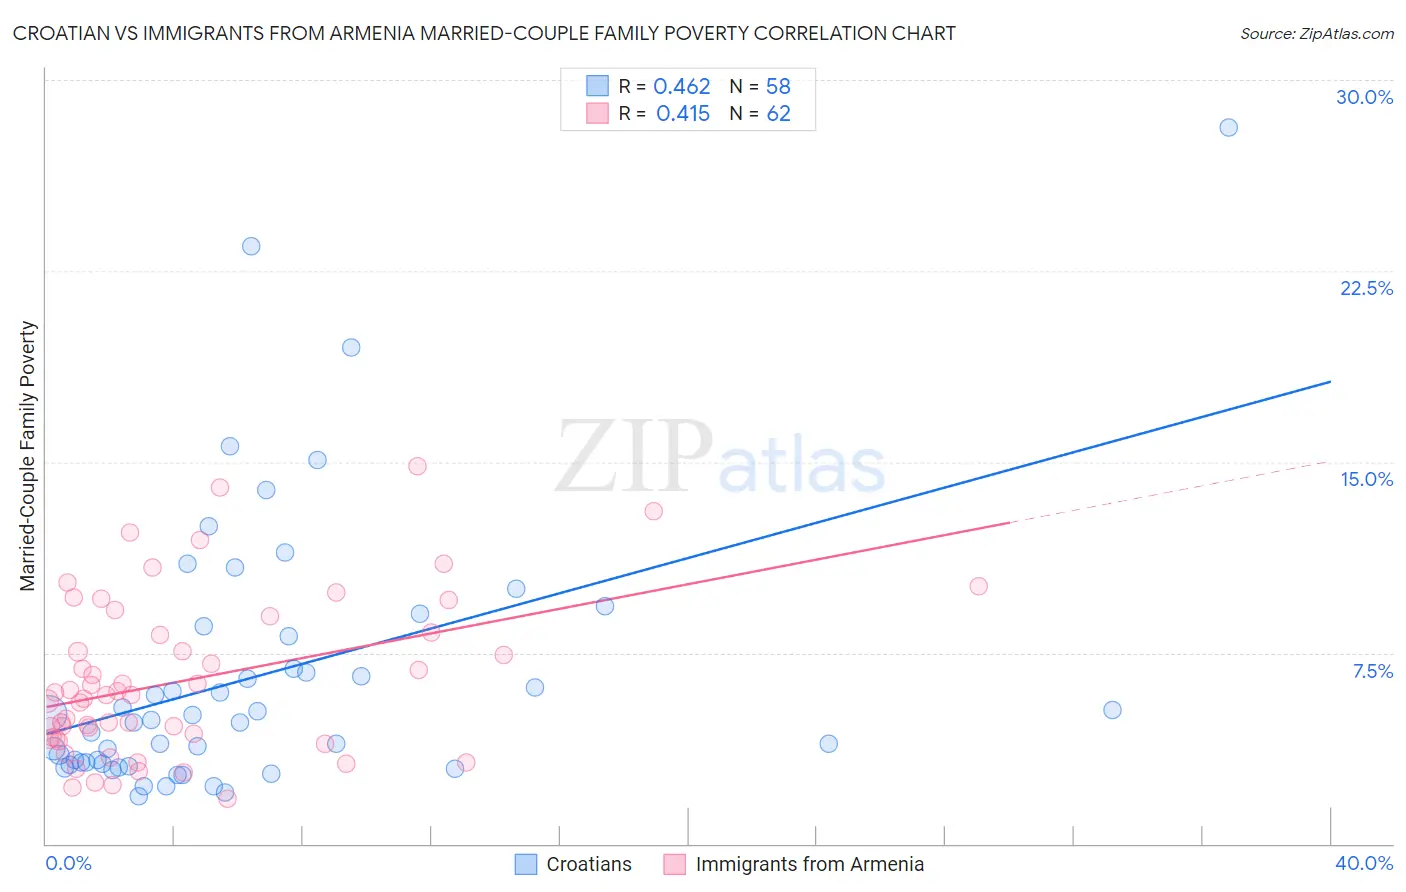
Croatian vs Immigrants from Armenia Married-Couple Family Poverty Correlation Chart
The statistical analysis conducted on geographies consisting of 371,918,028 people shows a moderate positive correlation between the proportion of Croatians and poverty level among married-couple families in the United States with a correlation coefficient (R) of 0.462 and weighted average of 3.9%. Similarly, the statistical analysis conducted on geographies consisting of 97,477,014 people shows a moderate positive correlation between the proportion of Immigrants from Armenia and poverty level among married-couple families in the United States with a correlation coefficient (R) of 0.415 and weighted average of 7.1%, a difference of 80.3%.
Married-Couple Family Poverty Correlation Summary
| Measurement | Croatian | Immigrants from Armenia |
| Minimum | 1.8% | 1.8% |
| Maximum | 28.1% | 14.8% |
| Range | 26.3% | 13.1% |
| Mean | 6.6% | 6.4% |
| Median | 4.8% | 5.9% |
| Interquartile 25% (IQ1) | 3.2% | 4.1% |
| Interquartile 75% (IQ3) | 8.1% | 8.3% |
| Interquartile Range (IQR) | 5.0% | 4.2% |
| Standard Deviation (Sample) | 5.3% | 3.1% |
| Standard Deviation (Population) | 5.3% | 3.1% |
Similar Demographics by Married-Couple Family Poverty
Demographics Similar to Croatians by Married-Couple Family Poverty
In terms of married-couple family poverty, the demographic groups most similar to Croatians are Carpatho Rusyn (3.9%, a difference of 0.050%), Thai (3.9%, a difference of 0.44%), Lithuanian (4.0%, a difference of 0.56%), Latvian (3.9%, a difference of 0.98%), and Bulgarian (4.0%, a difference of 1.3%).
| Demographics | Rating | Rank | Married-Couple Family Poverty |
| Chinese | 100.0 /100 | #2 | Exceptional 3.6% |
| Norwegians | 100.0 /100 | #3 | Exceptional 3.7% |
| Slovenes | 100.0 /100 | #4 | Exceptional 3.8% |
| Swedes | 100.0 /100 | #5 | Exceptional 3.9% |
| Luxembourgers | 100.0 /100 | #6 | Exceptional 3.9% |
| Latvians | 100.0 /100 | #7 | Exceptional 3.9% |
| Thais | 100.0 /100 | #8 | Exceptional 3.9% |
| Croatians | 100.0 /100 | #9 | Exceptional 3.9% |
| Carpatho Rusyns | 100.0 /100 | #10 | Exceptional 3.9% |
| Lithuanians | 100.0 /100 | #11 | Exceptional 4.0% |
| Bulgarians | 100.0 /100 | #12 | Exceptional 4.0% |
| Czechs | 100.0 /100 | #13 | Exceptional 4.0% |
| Slovaks | 100.0 /100 | #14 | Exceptional 4.0% |
| Poles | 100.0 /100 | #15 | Exceptional 4.0% |
| Germans | 100.0 /100 | #16 | Exceptional 4.0% |
Demographics Similar to Immigrants from Armenia by Married-Couple Family Poverty
In terms of married-couple family poverty, the demographic groups most similar to Immigrants from Armenia are Immigrants from Dominica (7.1%, a difference of 0.0%), Immigrants from Nicaragua (7.1%, a difference of 0.050%), Hopi (7.1%, a difference of 0.080%), Immigrants from St. Vincent and the Grenadines (7.1%, a difference of 0.11%), and British West Indian (7.1%, a difference of 0.41%).
| Demographics | Rating | Rank | Married-Couple Family Poverty |
| Haitians | 0.0 /100 | #305 | Tragic 6.8% |
| Immigrants | Haiti | 0.0 /100 | #306 | Tragic 7.0% |
| Guatemalans | 0.0 /100 | #307 | Tragic 7.0% |
| Spanish American Indians | 0.0 /100 | #308 | Tragic 7.1% |
| Hopi | 0.0 /100 | #309 | Tragic 7.1% |
| Immigrants | Nicaragua | 0.0 /100 | #310 | Tragic 7.1% |
| Immigrants | Dominica | 0.0 /100 | #311 | Tragic 7.1% |
| Immigrants | Armenia | 0.0 /100 | #312 | Tragic 7.1% |
| Immigrants | St. Vincent and the Grenadines | 0.0 /100 | #313 | Tragic 7.1% |
| British West Indians | 0.0 /100 | #314 | Tragic 7.1% |
| Inupiat | 0.0 /100 | #315 | Tragic 7.1% |
| Hondurans | 0.0 /100 | #316 | Tragic 7.2% |
| Mexicans | 0.0 /100 | #317 | Tragic 7.2% |
| Immigrants | Guatemala | 0.0 /100 | #318 | Tragic 7.2% |
| Immigrants | Latin America | 0.0 /100 | #319 | Tragic 7.2% |