Immigrants from Senegal vs Kiowa Single Male Poverty
COMPARE
Immigrants from Senegal
Kiowa
Single Male Poverty
Single Male Poverty Comparison
Immigrants from Senegal
Kiowa
13.5%
SINGLE MALE POVERTY
1.7/ 100
METRIC RATING
244th/ 347
METRIC RANK
18.3%
SINGLE MALE POVERTY
0.0/ 100
METRIC RATING
328th/ 347
METRIC RANK
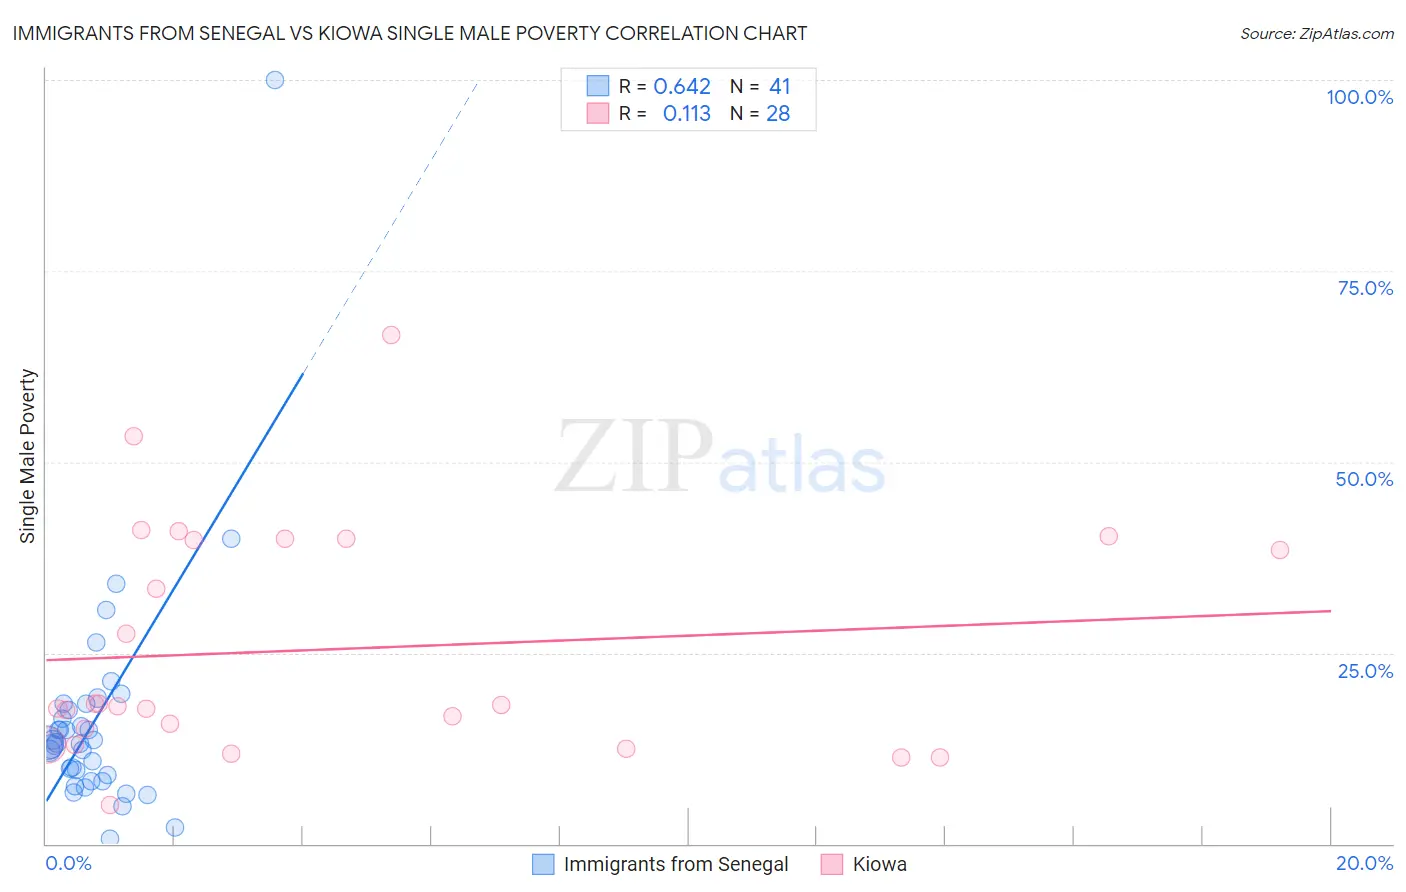
Immigrants from Senegal vs Kiowa Single Male Poverty Correlation Chart
The statistical analysis conducted on geographies consisting of 87,233,263 people shows a significant positive correlation between the proportion of Immigrants from Senegal and poverty level among single males in the United States with a correlation coefficient (R) of 0.642 and weighted average of 13.5%. Similarly, the statistical analysis conducted on geographies consisting of 54,682,389 people shows a poor positive correlation between the proportion of Kiowa and poverty level among single males in the United States with a correlation coefficient (R) of 0.113 and weighted average of 18.3%, a difference of 35.7%.
Single Male Poverty Correlation Summary
| Measurement | Immigrants from Senegal | Kiowa |
| Minimum | 0.68% | 5.0% |
| Maximum | 100.0% | 66.7% |
| Range | 99.3% | 61.7% |
| Mean | 16.1% | 25.4% |
| Median | 13.2% | 18.1% |
| Interquartile 25% (IQ1) | 8.6% | 14.0% |
| Interquartile 75% (IQ3) | 17.9% | 39.9% |
| Interquartile Range (IQR) | 9.3% | 25.9% |
| Standard Deviation (Sample) | 15.6% | 15.2% |
| Standard Deviation (Population) | 15.4% | 14.9% |
Similar Demographics by Single Male Poverty
Demographics Similar to Immigrants from Senegal by Single Male Poverty
In terms of single male poverty, the demographic groups most similar to Immigrants from Senegal are Immigrants from Latin America (13.5%, a difference of 0.26%), Barbadian (13.4%, a difference of 0.28%), Carpatho Rusyn (13.4%, a difference of 0.32%), Immigrants from Germany (13.4%, a difference of 0.33%), and Immigrants from Micronesia (13.5%, a difference of 0.36%).
| Demographics | Rating | Rank | Single Male Poverty |
| British West Indians | 3.4 /100 | #237 | Tragic 13.4% |
| Immigrants | Ghana | 3.2 /100 | #238 | Tragic 13.4% |
| Czechoslovakians | 3.0 /100 | #239 | Tragic 13.4% |
| Belizeans | 2.3 /100 | #240 | Tragic 13.4% |
| Immigrants | Germany | 2.1 /100 | #241 | Tragic 13.4% |
| Carpatho Rusyns | 2.1 /100 | #242 | Tragic 13.4% |
| Barbadians | 2.1 /100 | #243 | Tragic 13.4% |
| Immigrants | Senegal | 1.7 /100 | #244 | Tragic 13.5% |
| Immigrants | Latin America | 1.3 /100 | #245 | Tragic 13.5% |
| Immigrants | Micronesia | 1.2 /100 | #246 | Tragic 13.5% |
| Belgians | 1.2 /100 | #247 | Tragic 13.5% |
| Czechs | 1.2 /100 | #248 | Tragic 13.5% |
| Spanish | 1.0 /100 | #249 | Tragic 13.6% |
| Immigrants | Somalia | 1.0 /100 | #250 | Tragic 13.6% |
| Immigrants | Zaire | 0.9 /100 | #251 | Tragic 13.6% |
Demographics Similar to Kiowa by Single Male Poverty
In terms of single male poverty, the demographic groups most similar to Kiowa are Colville (18.4%, a difference of 0.73%), Menominee (17.7%, a difference of 3.3%), Cajun (19.1%, a difference of 4.2%), Paiute (19.3%, a difference of 5.4%), and Central American Indian (17.2%, a difference of 6.1%).
| Demographics | Rating | Rank | Single Male Poverty |
| Osage | 0.0 /100 | #321 | Tragic 16.5% |
| Shoshone | 0.0 /100 | #322 | Tragic 16.7% |
| Creek | 0.0 /100 | #323 | Tragic 16.8% |
| Immigrants | Yemen | 0.0 /100 | #324 | Tragic 16.9% |
| Choctaw | 0.0 /100 | #325 | Tragic 17.0% |
| Central American Indians | 0.0 /100 | #326 | Tragic 17.2% |
| Menominee | 0.0 /100 | #327 | Tragic 17.7% |
| Kiowa | 0.0 /100 | #328 | Tragic 18.3% |
| Colville | 0.0 /100 | #329 | Tragic 18.4% |
| Cajuns | 0.0 /100 | #330 | Tragic 19.1% |
| Paiute | 0.0 /100 | #331 | Tragic 19.3% |
| Natives/Alaskans | 0.0 /100 | #332 | Tragic 19.6% |
| Inupiat | 0.0 /100 | #333 | Tragic 20.0% |
| Pima | 0.0 /100 | #334 | Tragic 20.2% |
| Yuman | 0.0 /100 | #335 | Tragic 21.3% |