Cree vs Immigrants from Micronesia Female Poverty
COMPARE
Cree
Immigrants from Micronesia
Female Poverty
Female Poverty Comparison
Cree
Immigrants from Micronesia
15.1%
FEMALE POVERTY
0.7/ 100
METRIC RATING
236th/ 347
METRIC RANK
14.6%
FEMALE POVERTY
2.8/ 100
METRIC RATING
225th/ 347
METRIC RANK
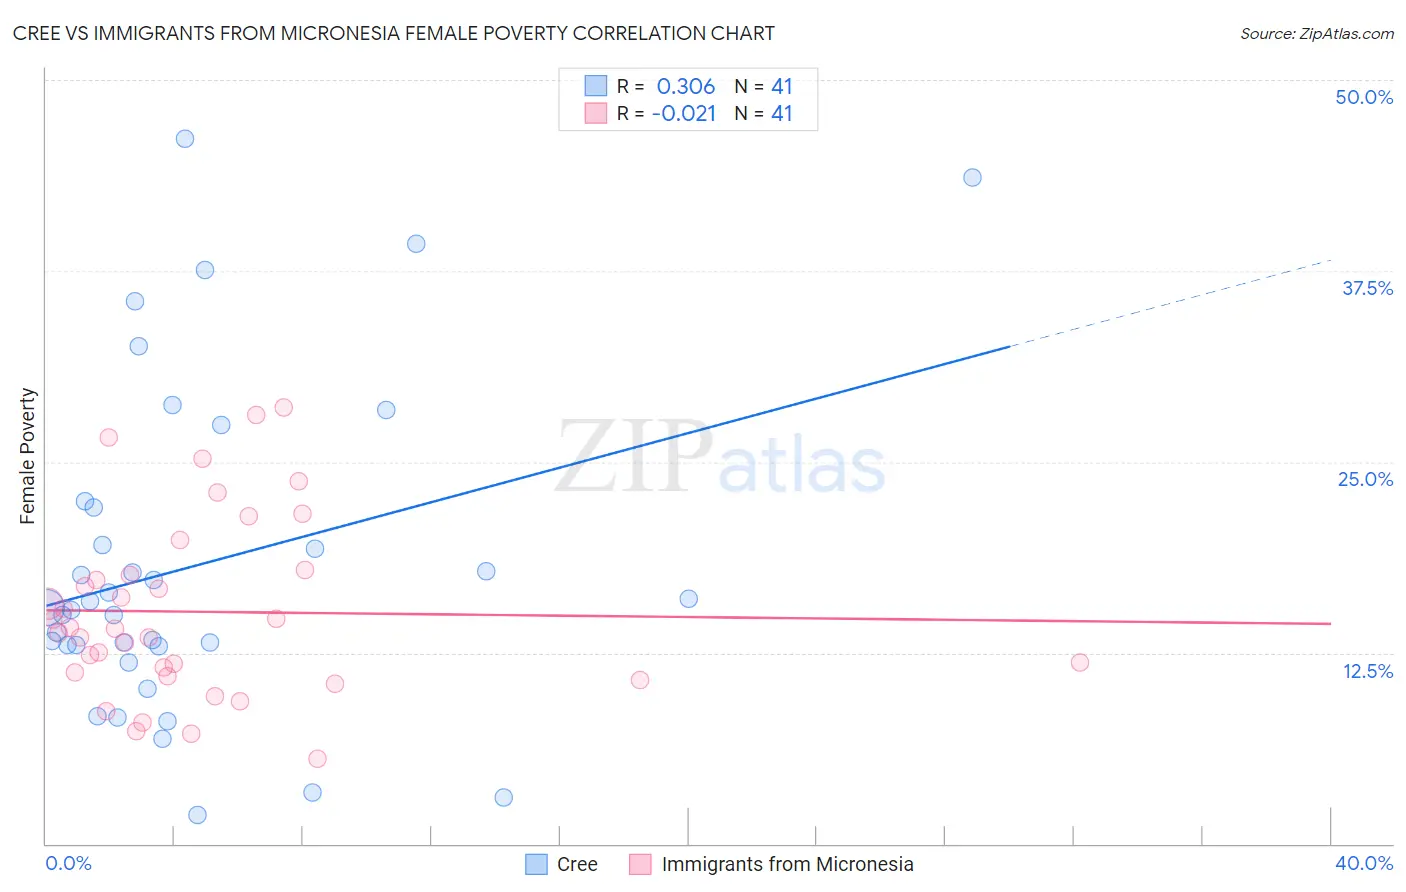
Cree vs Immigrants from Micronesia Female Poverty Correlation Chart
The statistical analysis conducted on geographies consisting of 76,205,859 people shows a mild positive correlation between the proportion of Cree and poverty level among females in the United States with a correlation coefficient (R) of 0.306 and weighted average of 15.1%. Similarly, the statistical analysis conducted on geographies consisting of 61,598,516 people shows no correlation between the proportion of Immigrants from Micronesia and poverty level among females in the United States with a correlation coefficient (R) of -0.021 and weighted average of 14.6%, a difference of 3.2%.
Female Poverty Correlation Summary
| Measurement | Cree | Immigrants from Micronesia |
| Minimum | 1.9% | 5.5% |
| Maximum | 46.1% | 28.6% |
| Range | 44.3% | 23.0% |
| Mean | 18.3% | 15.2% |
| Median | 15.5% | 14.1% |
| Interquartile 25% (IQ1) | 13.0% | 11.1% |
| Interquartile 75% (IQ3) | 22.2% | 17.8% |
| Interquartile Range (IQR) | 9.2% | 6.7% |
| Standard Deviation (Sample) | 10.7% | 5.8% |
| Standard Deviation (Population) | 10.6% | 5.7% |
Demographics Similar to Cree and Immigrants from Micronesia by Female Poverty
In terms of female poverty, the demographic groups most similar to Cree are French American Indian (15.1%, a difference of 0.19%), Immigrants from Armenia (15.1%, a difference of 0.26%), Immigrants from Laos (15.0%, a difference of 0.63%), Immigrants from Middle Africa (15.2%, a difference of 0.78%), and Sudanese (15.2%, a difference of 0.84%). Similarly, the demographic groups most similar to Immigrants from Micronesia are American (14.6%, a difference of 0.0%), Immigrants from Eritrea (14.6%, a difference of 0.33%), Immigrants from Africa (14.5%, a difference of 0.40%), Nonimmigrants (14.5%, a difference of 0.63%), and Immigrants from Nigeria (14.7%, a difference of 0.64%).
| Demographics | Rating | Rank | Female Poverty |
| Alsatians | 4.0 /100 | #220 | Tragic 14.5% |
| Immigrants | Cambodia | 3.7 /100 | #221 | Tragic 14.5% |
| Immigrants | Nonimmigrants | 3.7 /100 | #222 | Tragic 14.5% |
| Immigrants | Africa | 3.3 /100 | #223 | Tragic 14.5% |
| Americans | 2.8 /100 | #224 | Tragic 14.6% |
| Immigrants | Micronesia | 2.8 /100 | #225 | Tragic 14.6% |
| Immigrants | Eritrea | 2.4 /100 | #226 | Tragic 14.6% |
| Immigrants | Nigeria | 2.1 /100 | #227 | Tragic 14.7% |
| German Russians | 2.0 /100 | #228 | Tragic 14.7% |
| Ghanaians | 1.9 /100 | #229 | Tragic 14.7% |
| Alaska Natives | 1.8 /100 | #230 | Tragic 14.7% |
| Nigerians | 1.7 /100 | #231 | Tragic 14.8% |
| Osage | 1.5 /100 | #232 | Tragic 14.8% |
| Immigrants | Saudi Arabia | 1.4 /100 | #233 | Tragic 14.8% |
| Fijians | 1.1 /100 | #234 | Tragic 14.9% |
| Immigrants | Laos | 0.9 /100 | #235 | Tragic 15.0% |
| Cree | 0.7 /100 | #236 | Tragic 15.1% |
| French American Indians | 0.6 /100 | #237 | Tragic 15.1% |
| Immigrants | Armenia | 0.6 /100 | #238 | Tragic 15.1% |
| Immigrants | Middle Africa | 0.5 /100 | #239 | Tragic 15.2% |
| Sudanese | 0.5 /100 | #240 | Tragic 15.2% |