Cree vs Immigrants from Cuba Female Poverty
COMPARE
Cree
Immigrants from Cuba
Female Poverty
Female Poverty Comparison
Cree
Immigrants from Cuba
15.1%
FEMALE POVERTY
0.7/ 100
METRIC RATING
236th/ 347
METRIC RANK
16.1%
FEMALE POVERTY
0.0/ 100
METRIC RATING
283rd/ 347
METRIC RANK
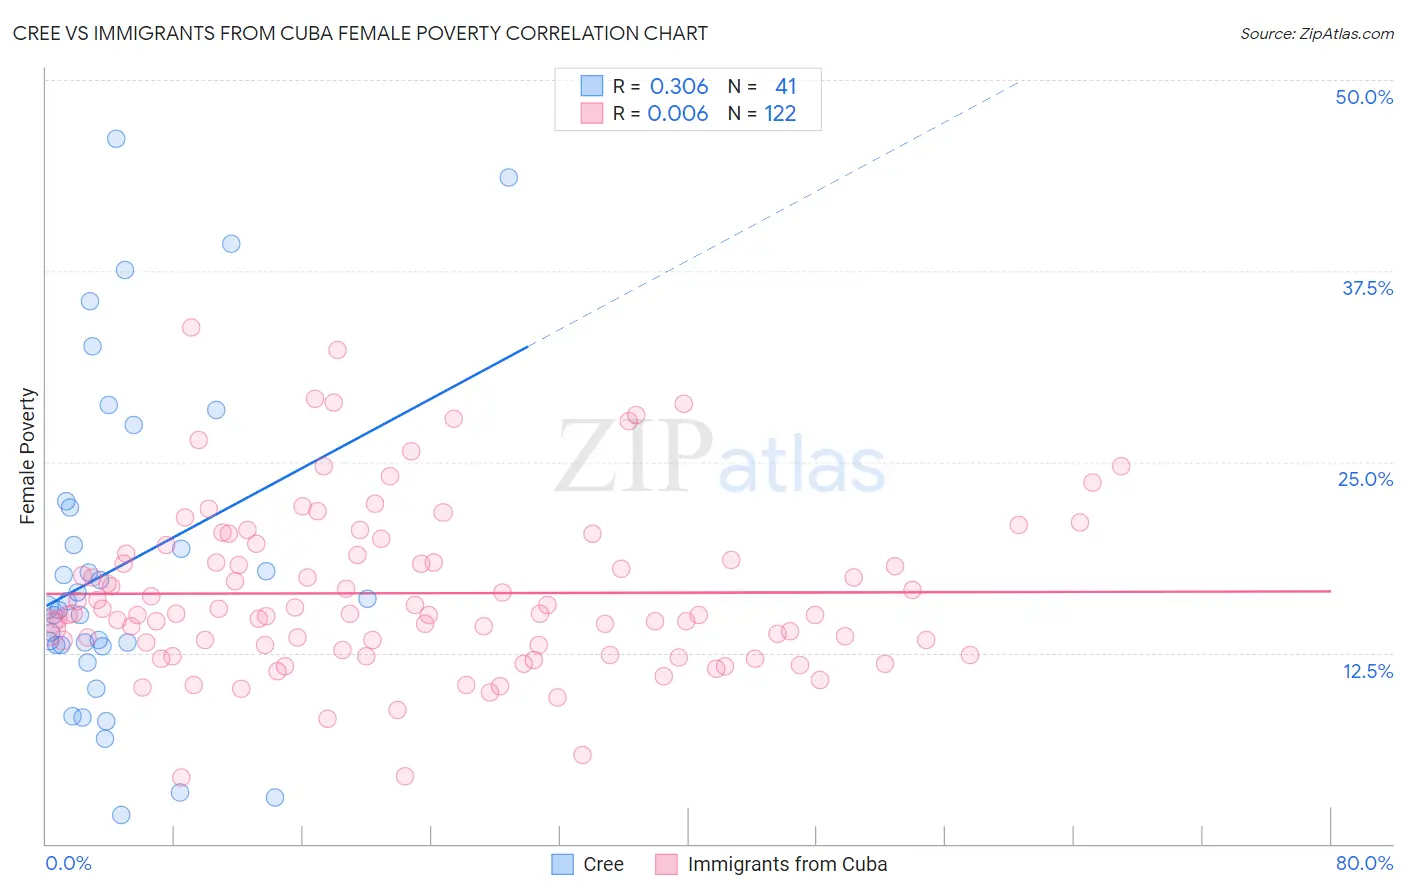
Cree vs Immigrants from Cuba Female Poverty Correlation Chart
The statistical analysis conducted on geographies consisting of 76,205,859 people shows a mild positive correlation between the proportion of Cree and poverty level among females in the United States with a correlation coefficient (R) of 0.306 and weighted average of 15.1%. Similarly, the statistical analysis conducted on geographies consisting of 325,939,480 people shows no correlation between the proportion of Immigrants from Cuba and poverty level among females in the United States with a correlation coefficient (R) of 0.006 and weighted average of 16.1%, a difference of 7.3%.
Female Poverty Correlation Summary
| Measurement | Cree | Immigrants from Cuba |
| Minimum | 1.9% | 4.3% |
| Maximum | 46.1% | 33.8% |
| Range | 44.3% | 29.5% |
| Mean | 18.3% | 16.4% |
| Median | 15.5% | 15.0% |
| Interquartile 25% (IQ1) | 13.0% | 13.0% |
| Interquartile 75% (IQ3) | 22.2% | 19.0% |
| Interquartile Range (IQR) | 9.2% | 6.0% |
| Standard Deviation (Sample) | 10.7% | 5.5% |
| Standard Deviation (Population) | 10.6% | 5.4% |
Similar Demographics by Female Poverty
Demographics Similar to Cree by Female Poverty
In terms of female poverty, the demographic groups most similar to Cree are French American Indian (15.1%, a difference of 0.19%), Immigrants from Armenia (15.1%, a difference of 0.26%), Immigrants from Laos (15.0%, a difference of 0.63%), Immigrants from Middle Africa (15.2%, a difference of 0.78%), and Sudanese (15.2%, a difference of 0.84%).
| Demographics | Rating | Rank | Female Poverty |
| Ghanaians | 1.9 /100 | #229 | Tragic 14.7% |
| Alaska Natives | 1.8 /100 | #230 | Tragic 14.7% |
| Nigerians | 1.7 /100 | #231 | Tragic 14.8% |
| Osage | 1.5 /100 | #232 | Tragic 14.8% |
| Immigrants | Saudi Arabia | 1.4 /100 | #233 | Tragic 14.8% |
| Fijians | 1.1 /100 | #234 | Tragic 14.9% |
| Immigrants | Laos | 0.9 /100 | #235 | Tragic 15.0% |
| Cree | 0.7 /100 | #236 | Tragic 15.1% |
| French American Indians | 0.6 /100 | #237 | Tragic 15.1% |
| Immigrants | Armenia | 0.6 /100 | #238 | Tragic 15.1% |
| Immigrants | Middle Africa | 0.5 /100 | #239 | Tragic 15.2% |
| Sudanese | 0.5 /100 | #240 | Tragic 15.2% |
| Immigrants | Sudan | 0.4 /100 | #241 | Tragic 15.2% |
| Nepalese | 0.4 /100 | #242 | Tragic 15.2% |
| Nicaraguans | 0.3 /100 | #243 | Tragic 15.3% |
Demographics Similar to Immigrants from Cuba by Female Poverty
In terms of female poverty, the demographic groups most similar to Immigrants from Cuba are Spanish American (16.2%, a difference of 0.050%), Immigrants from Haiti (16.1%, a difference of 0.080%), Comanche (16.2%, a difference of 0.13%), West Indian (16.1%, a difference of 0.24%), and Vietnamese (16.1%, a difference of 0.26%).
| Demographics | Rating | Rank | Female Poverty |
| Central Americans | 0.0 /100 | #276 | Tragic 16.0% |
| Bangladeshis | 0.0 /100 | #277 | Tragic 16.0% |
| Immigrants | West Indies | 0.0 /100 | #278 | Tragic 16.1% |
| Immigrants | Bahamas | 0.0 /100 | #279 | Tragic 16.1% |
| Vietnamese | 0.0 /100 | #280 | Tragic 16.1% |
| West Indians | 0.0 /100 | #281 | Tragic 16.1% |
| Immigrants | Haiti | 0.0 /100 | #282 | Tragic 16.1% |
| Immigrants | Cuba | 0.0 /100 | #283 | Tragic 16.1% |
| Spanish Americans | 0.0 /100 | #284 | Tragic 16.2% |
| Comanche | 0.0 /100 | #285 | Tragic 16.2% |
| Inupiat | 0.0 /100 | #286 | Tragic 16.2% |
| Immigrants | Belize | 0.0 /100 | #287 | Tragic 16.3% |
| Indonesians | 0.0 /100 | #288 | Tragic 16.4% |
| Blackfeet | 0.0 /100 | #289 | Tragic 16.4% |
| Immigrants | Bangladesh | 0.0 /100 | #290 | Tragic 16.4% |