Cree vs Soviet Union Female Unemployment
COMPARE
Cree
Soviet Union
Female Unemployment
Female Unemployment Comparison
Cree
Soviet Union
5.6%
FEMALE UNEMPLOYMENT
1.0/ 100
METRIC RATING
248th/ 347
METRIC RANK
5.4%
FEMALE UNEMPLOYMENT
21.7/ 100
METRIC RATING
200th/ 347
METRIC RANK
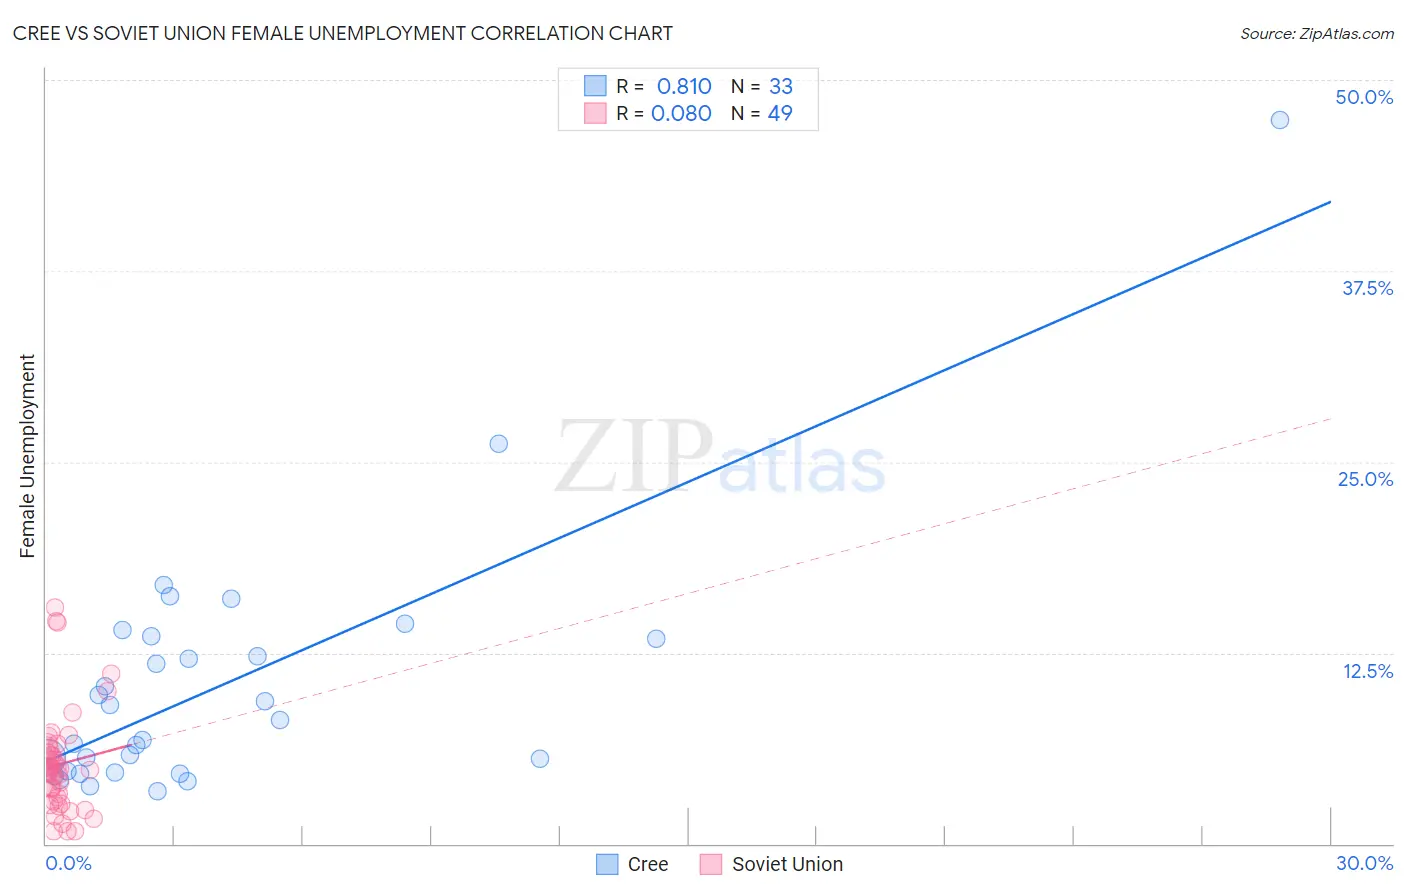
Cree vs Soviet Union Female Unemployment Correlation Chart
The statistical analysis conducted on geographies consisting of 76,053,409 people shows a very strong positive correlation between the proportion of Cree and unemploymnet rate among females in the United States with a correlation coefficient (R) of 0.810 and weighted average of 5.6%. Similarly, the statistical analysis conducted on geographies consisting of 43,498,217 people shows a slight positive correlation between the proportion of Soviet Union and unemploymnet rate among females in the United States with a correlation coefficient (R) of 0.080 and weighted average of 5.4%, a difference of 4.9%.
Female Unemployment Correlation Summary
| Measurement | Cree | Soviet Union |
| Minimum | 3.4% | 0.80% |
| Maximum | 47.4% | 15.5% |
| Range | 44.0% | 14.7% |
| Mean | 10.4% | 5.2% |
| Median | 8.1% | 4.9% |
| Interquartile 25% (IQ1) | 4.7% | 2.9% |
| Interquartile 75% (IQ3) | 13.5% | 6.1% |
| Interquartile Range (IQR) | 8.8% | 3.2% |
| Standard Deviation (Sample) | 8.4% | 3.3% |
| Standard Deviation (Population) | 8.3% | 3.3% |
Similar Demographics by Female Unemployment
Demographics Similar to Cree by Female Unemployment
In terms of female unemployment, the demographic groups most similar to Cree are Immigrants from Uzbekistan (5.6%, a difference of 0.040%), Immigrants from Western Asia (5.6%, a difference of 0.16%), Japanese (5.6%, a difference of 0.24%), Immigrants from Syria (5.6%, a difference of 0.33%), and Assyrian/Chaldean/Syriac (5.6%, a difference of 0.39%).
| Demographics | Rating | Rank | Female Unemployment |
| South American Indians | 2.8 /100 | #241 | Tragic 5.5% |
| Marshallese | 2.3 /100 | #242 | Tragic 5.6% |
| Spanish Americans | 2.2 /100 | #243 | Tragic 5.6% |
| Immigrants | Liberia | 1.5 /100 | #244 | Tragic 5.6% |
| Guamanians/Chamorros | 1.4 /100 | #245 | Tragic 5.6% |
| Japanese | 1.2 /100 | #246 | Tragic 5.6% |
| Immigrants | Western Asia | 1.1 /100 | #247 | Tragic 5.6% |
| Cree | 1.0 /100 | #248 | Tragic 5.6% |
| Immigrants | Uzbekistan | 1.0 /100 | #249 | Tragic 5.6% |
| Immigrants | Syria | 0.8 /100 | #250 | Tragic 5.6% |
| Assyrians/Chaldeans/Syriacs | 0.8 /100 | #251 | Tragic 5.6% |
| Cajuns | 0.7 /100 | #252 | Tragic 5.7% |
| Immigrants | Sierra Leone | 0.6 /100 | #253 | Tragic 5.7% |
| Immigrants | Immigrants | 0.6 /100 | #254 | Tragic 5.7% |
| Immigrants | Cameroon | 0.6 /100 | #255 | Tragic 5.7% |
Demographics Similar to Soviet Union by Female Unemployment
In terms of female unemployment, the demographic groups most similar to Soviet Union are Hawaiian (5.4%, a difference of 0.040%), Immigrants from Middle Africa (5.4%, a difference of 0.080%), Iroquois (5.4%, a difference of 0.080%), Tsimshian (5.4%, a difference of 0.12%), and Immigrants from South Eastern Asia (5.4%, a difference of 0.12%).
| Demographics | Rating | Rank | Female Unemployment |
| Arabs | 27.7 /100 | #193 | Fair 5.3% |
| Colombians | 27.0 /100 | #194 | Fair 5.3% |
| Immigrants | Colombia | 26.2 /100 | #195 | Fair 5.3% |
| Spaniards | 25.2 /100 | #196 | Fair 5.3% |
| Alsatians | 23.9 /100 | #197 | Fair 5.3% |
| Tsimshian | 23.1 /100 | #198 | Fair 5.4% |
| Hawaiians | 22.2 /100 | #199 | Fair 5.4% |
| Soviet Union | 21.7 /100 | #200 | Fair 5.4% |
| Immigrants | Middle Africa | 20.8 /100 | #201 | Fair 5.4% |
| Iroquois | 20.8 /100 | #202 | Fair 5.4% |
| Immigrants | South Eastern Asia | 20.3 /100 | #203 | Fair 5.4% |
| Immigrants | Israel | 19.7 /100 | #204 | Poor 5.4% |
| Immigrants | Afghanistan | 18.9 /100 | #205 | Poor 5.4% |
| Immigrants | Brazil | 18.8 /100 | #206 | Poor 5.4% |
| Creek | 15.4 /100 | #207 | Poor 5.4% |