Cree vs Immigrants from Lebanon Female Poverty
COMPARE
Cree
Immigrants from Lebanon
Female Poverty
Female Poverty Comparison
Cree
Immigrants from Lebanon
15.1%
FEMALE POVERTY
0.7/ 100
METRIC RATING
236th/ 347
METRIC RANK
13.8%
FEMALE POVERTY
25.6/ 100
METRIC RATING
199th/ 347
METRIC RANK
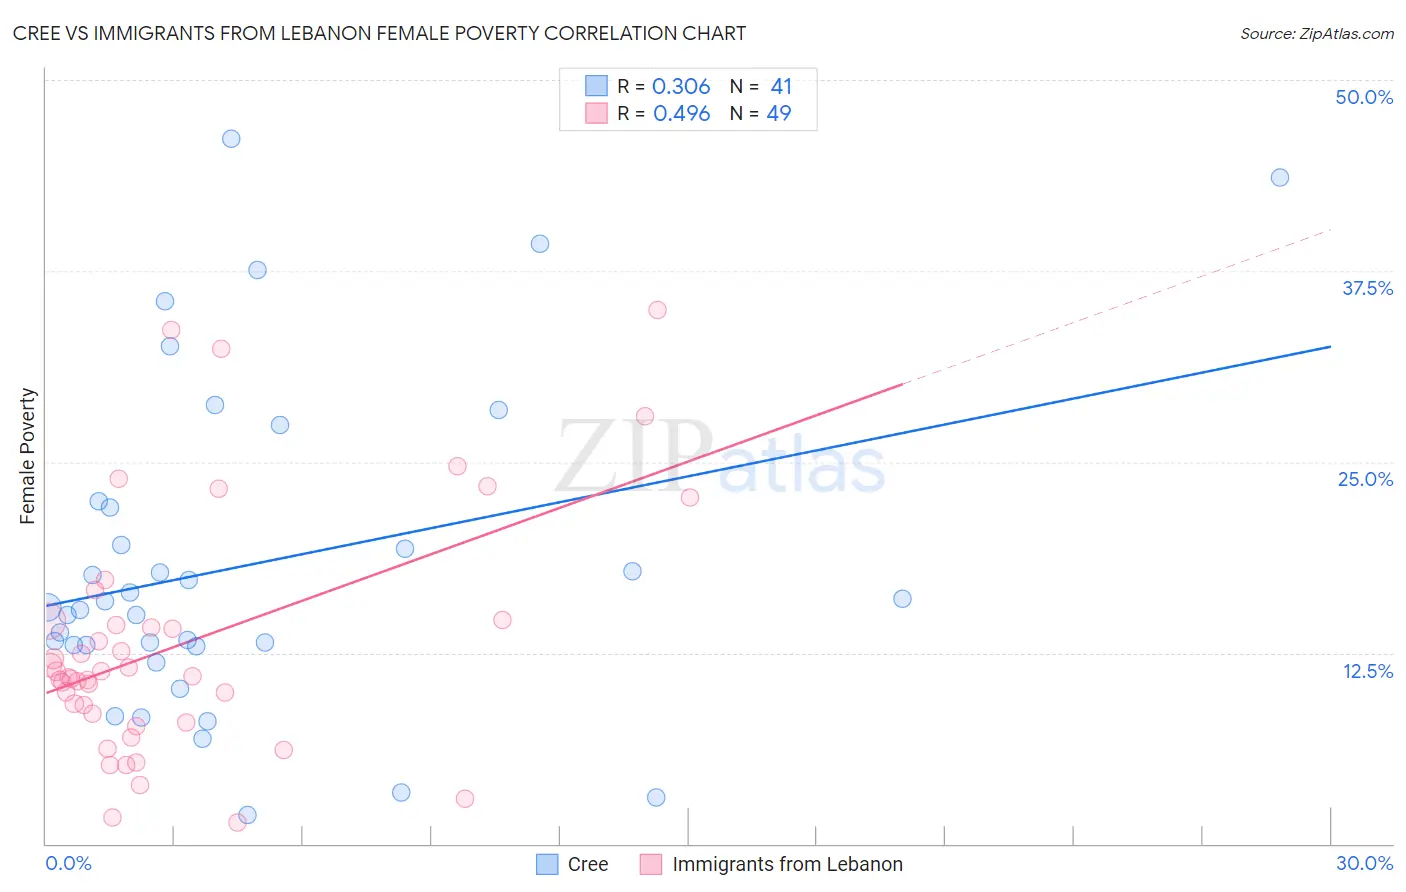
Cree vs Immigrants from Lebanon Female Poverty Correlation Chart
The statistical analysis conducted on geographies consisting of 76,205,859 people shows a mild positive correlation between the proportion of Cree and poverty level among females in the United States with a correlation coefficient (R) of 0.306 and weighted average of 15.1%. Similarly, the statistical analysis conducted on geographies consisting of 217,101,802 people shows a moderate positive correlation between the proportion of Immigrants from Lebanon and poverty level among females in the United States with a correlation coefficient (R) of 0.496 and weighted average of 13.8%, a difference of 9.2%.
Female Poverty Correlation Summary
| Measurement | Cree | Immigrants from Lebanon |
| Minimum | 1.9% | 1.4% |
| Maximum | 46.1% | 35.0% |
| Range | 44.3% | 33.6% |
| Mean | 18.3% | 13.1% |
| Median | 15.5% | 11.0% |
| Interquartile 25% (IQ1) | 13.0% | 8.2% |
| Interquartile 75% (IQ3) | 22.2% | 14.6% |
| Interquartile Range (IQR) | 9.2% | 6.4% |
| Standard Deviation (Sample) | 10.7% | 8.0% |
| Standard Deviation (Population) | 10.6% | 7.9% |
Similar Demographics by Female Poverty
Demographics Similar to Cree by Female Poverty
In terms of female poverty, the demographic groups most similar to Cree are French American Indian (15.1%, a difference of 0.19%), Immigrants from Armenia (15.1%, a difference of 0.26%), Immigrants from Laos (15.0%, a difference of 0.63%), Immigrants from Middle Africa (15.2%, a difference of 0.78%), and Sudanese (15.2%, a difference of 0.84%).
| Demographics | Rating | Rank | Female Poverty |
| Ghanaians | 1.9 /100 | #229 | Tragic 14.7% |
| Alaska Natives | 1.8 /100 | #230 | Tragic 14.7% |
| Nigerians | 1.7 /100 | #231 | Tragic 14.8% |
| Osage | 1.5 /100 | #232 | Tragic 14.8% |
| Immigrants | Saudi Arabia | 1.4 /100 | #233 | Tragic 14.8% |
| Fijians | 1.1 /100 | #234 | Tragic 14.9% |
| Immigrants | Laos | 0.9 /100 | #235 | Tragic 15.0% |
| Cree | 0.7 /100 | #236 | Tragic 15.1% |
| French American Indians | 0.6 /100 | #237 | Tragic 15.1% |
| Immigrants | Armenia | 0.6 /100 | #238 | Tragic 15.1% |
| Immigrants | Middle Africa | 0.5 /100 | #239 | Tragic 15.2% |
| Sudanese | 0.5 /100 | #240 | Tragic 15.2% |
| Immigrants | Sudan | 0.4 /100 | #241 | Tragic 15.2% |
| Nepalese | 0.4 /100 | #242 | Tragic 15.2% |
| Nicaraguans | 0.3 /100 | #243 | Tragic 15.3% |
Demographics Similar to Immigrants from Lebanon by Female Poverty
In terms of female poverty, the demographic groups most similar to Immigrants from Lebanon are Immigrants from Uganda (13.7%, a difference of 0.34%), Arab (13.7%, a difference of 0.35%), South American Indian (13.7%, a difference of 0.39%), Spanish (13.9%, a difference of 0.55%), and Immigrants from South America (13.7%, a difference of 0.58%).
| Demographics | Rating | Rank | Female Poverty |
| Immigrants | Costa Rica | 31.9 /100 | #192 | Fair 13.7% |
| Iraqis | 31.8 /100 | #193 | Fair 13.7% |
| Delaware | 31.1 /100 | #194 | Fair 13.7% |
| Immigrants | South America | 30.6 /100 | #195 | Fair 13.7% |
| South American Indians | 28.9 /100 | #196 | Fair 13.7% |
| Arabs | 28.6 /100 | #197 | Fair 13.7% |
| Immigrants | Uganda | 28.5 /100 | #198 | Fair 13.7% |
| Immigrants | Lebanon | 25.6 /100 | #199 | Fair 13.8% |
| Spanish | 21.4 /100 | #200 | Fair 13.9% |
| Immigrants | Kenya | 21.1 /100 | #201 | Fair 13.9% |
| Hmong | 21.1 /100 | #202 | Fair 13.9% |
| Immigrants | Western Asia | 20.7 /100 | #203 | Fair 13.9% |
| Spaniards | 18.9 /100 | #204 | Poor 13.9% |
| Ugandans | 15.4 /100 | #205 | Poor 14.0% |
| Immigrants | Uruguay | 14.0 /100 | #206 | Poor 14.0% |