Cree vs Macedonian Female Poverty
COMPARE
Cree
Macedonian
Female Poverty
Female Poverty Comparison
Cree
Macedonians
15.1%
FEMALE POVERTY
0.7/ 100
METRIC RATING
236th/ 347
METRIC RANK
11.8%
FEMALE POVERTY
99.3/ 100
METRIC RATING
40th/ 347
METRIC RANK
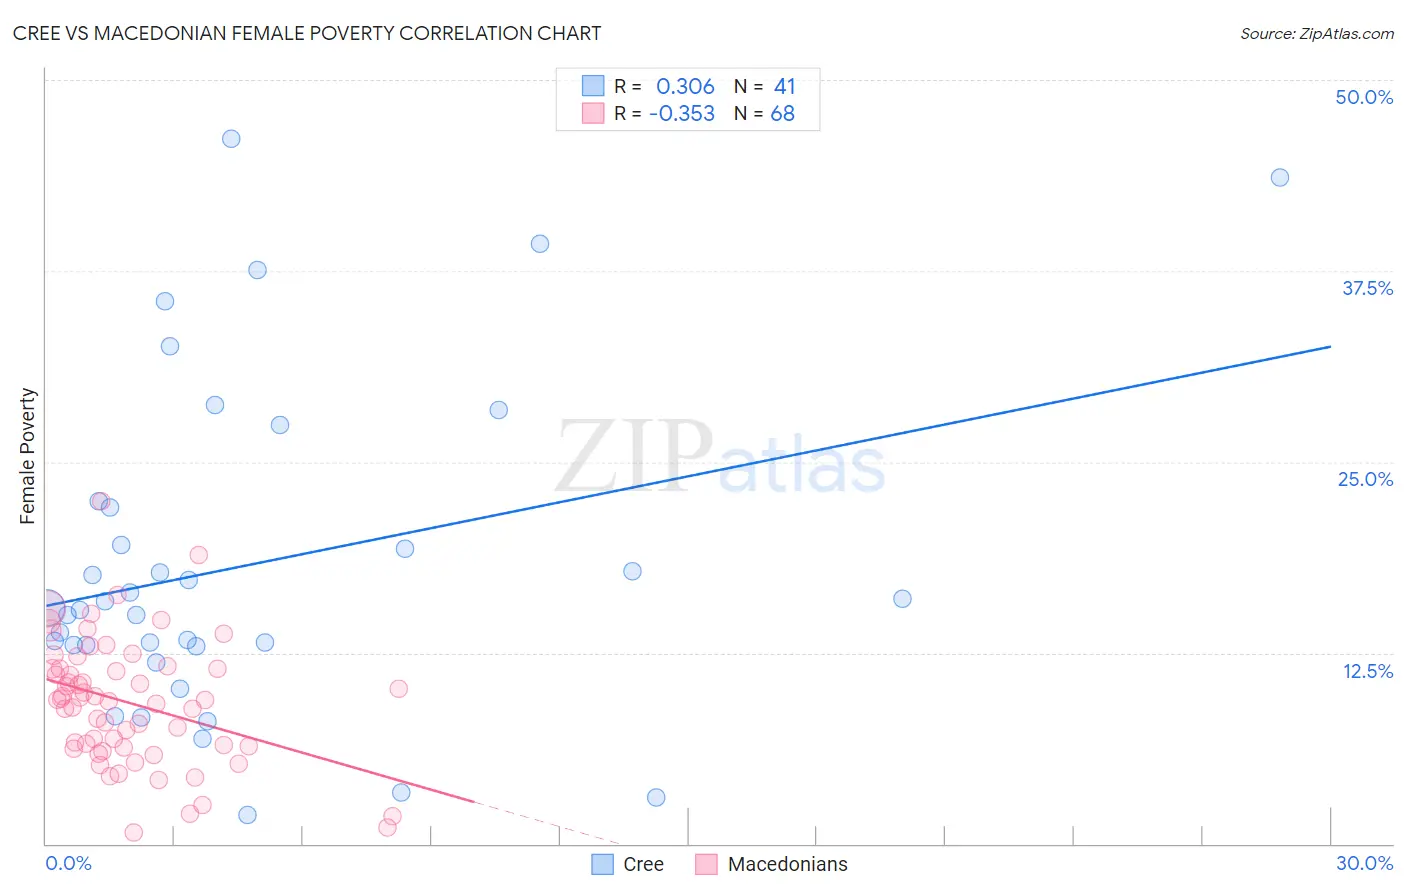
Cree vs Macedonian Female Poverty Correlation Chart
The statistical analysis conducted on geographies consisting of 76,205,859 people shows a mild positive correlation between the proportion of Cree and poverty level among females in the United States with a correlation coefficient (R) of 0.306 and weighted average of 15.1%. Similarly, the statistical analysis conducted on geographies consisting of 132,594,768 people shows a mild negative correlation between the proportion of Macedonians and poverty level among females in the United States with a correlation coefficient (R) of -0.353 and weighted average of 11.8%, a difference of 27.0%.
Female Poverty Correlation Summary
| Measurement | Cree | Macedonian |
| Minimum | 1.9% | 0.74% |
| Maximum | 46.1% | 22.4% |
| Range | 44.3% | 21.7% |
| Mean | 18.3% | 9.2% |
| Median | 15.5% | 9.4% |
| Interquartile 25% (IQ1) | 13.0% | 6.3% |
| Interquartile 75% (IQ3) | 22.2% | 11.5% |
| Interquartile Range (IQR) | 9.2% | 5.1% |
| Standard Deviation (Sample) | 10.7% | 4.1% |
| Standard Deviation (Population) | 10.6% | 4.1% |
Similar Demographics by Female Poverty
Demographics Similar to Cree by Female Poverty
In terms of female poverty, the demographic groups most similar to Cree are French American Indian (15.1%, a difference of 0.19%), Immigrants from Armenia (15.1%, a difference of 0.26%), Immigrants from Laos (15.0%, a difference of 0.63%), Immigrants from Middle Africa (15.2%, a difference of 0.78%), and Sudanese (15.2%, a difference of 0.84%).
| Demographics | Rating | Rank | Female Poverty |
| Ghanaians | 1.9 /100 | #229 | Tragic 14.7% |
| Alaska Natives | 1.8 /100 | #230 | Tragic 14.7% |
| Nigerians | 1.7 /100 | #231 | Tragic 14.8% |
| Osage | 1.5 /100 | #232 | Tragic 14.8% |
| Immigrants | Saudi Arabia | 1.4 /100 | #233 | Tragic 14.8% |
| Fijians | 1.1 /100 | #234 | Tragic 14.9% |
| Immigrants | Laos | 0.9 /100 | #235 | Tragic 15.0% |
| Cree | 0.7 /100 | #236 | Tragic 15.1% |
| French American Indians | 0.6 /100 | #237 | Tragic 15.1% |
| Immigrants | Armenia | 0.6 /100 | #238 | Tragic 15.1% |
| Immigrants | Middle Africa | 0.5 /100 | #239 | Tragic 15.2% |
| Sudanese | 0.5 /100 | #240 | Tragic 15.2% |
| Immigrants | Sudan | 0.4 /100 | #241 | Tragic 15.2% |
| Nepalese | 0.4 /100 | #242 | Tragic 15.2% |
| Nicaraguans | 0.3 /100 | #243 | Tragic 15.3% |
Demographics Similar to Macedonians by Female Poverty
In terms of female poverty, the demographic groups most similar to Macedonians are Immigrants from Poland (11.8%, a difference of 0.050%), Czech (11.9%, a difference of 0.18%), Immigrants from Moldova (11.9%, a difference of 0.18%), Korean (11.9%, a difference of 0.22%), and Russian (11.8%, a difference of 0.26%).
| Demographics | Rating | Rank | Female Poverty |
| Cypriots | 99.5 /100 | #33 | Exceptional 11.8% |
| Immigrants | Singapore | 99.4 /100 | #34 | Exceptional 11.8% |
| Immigrants | Iran | 99.4 /100 | #35 | Exceptional 11.8% |
| Immigrants | Pakistan | 99.4 /100 | #36 | Exceptional 11.8% |
| Immigrants | Greece | 99.3 /100 | #37 | Exceptional 11.8% |
| Russians | 99.3 /100 | #38 | Exceptional 11.8% |
| Immigrants | Poland | 99.3 /100 | #39 | Exceptional 11.8% |
| Macedonians | 99.3 /100 | #40 | Exceptional 11.8% |
| Czechs | 99.2 /100 | #41 | Exceptional 11.9% |
| Immigrants | Moldova | 99.2 /100 | #42 | Exceptional 11.9% |
| Koreans | 99.2 /100 | #43 | Exceptional 11.9% |
| Tongans | 99.2 /100 | #44 | Exceptional 11.9% |
| Immigrants | Czechoslovakia | 99.2 /100 | #45 | Exceptional 11.9% |
| Turks | 99.2 /100 | #46 | Exceptional 11.9% |
| Asians | 99.1 /100 | #47 | Exceptional 11.9% |