Cree vs Immigrants from Oceania Divorced or Separated
COMPARE
Cree
Immigrants from Oceania
Divorced or Separated
Divorced or Separated Comparison
Cree
Immigrants from Oceania
13.4%
DIVORCED OR SEPARATED
0.0/ 100
METRIC RATING
318th/ 347
METRIC RANK
11.9%
DIVORCED OR SEPARATED
77.7/ 100
METRIC RATING
149th/ 347
METRIC RANK
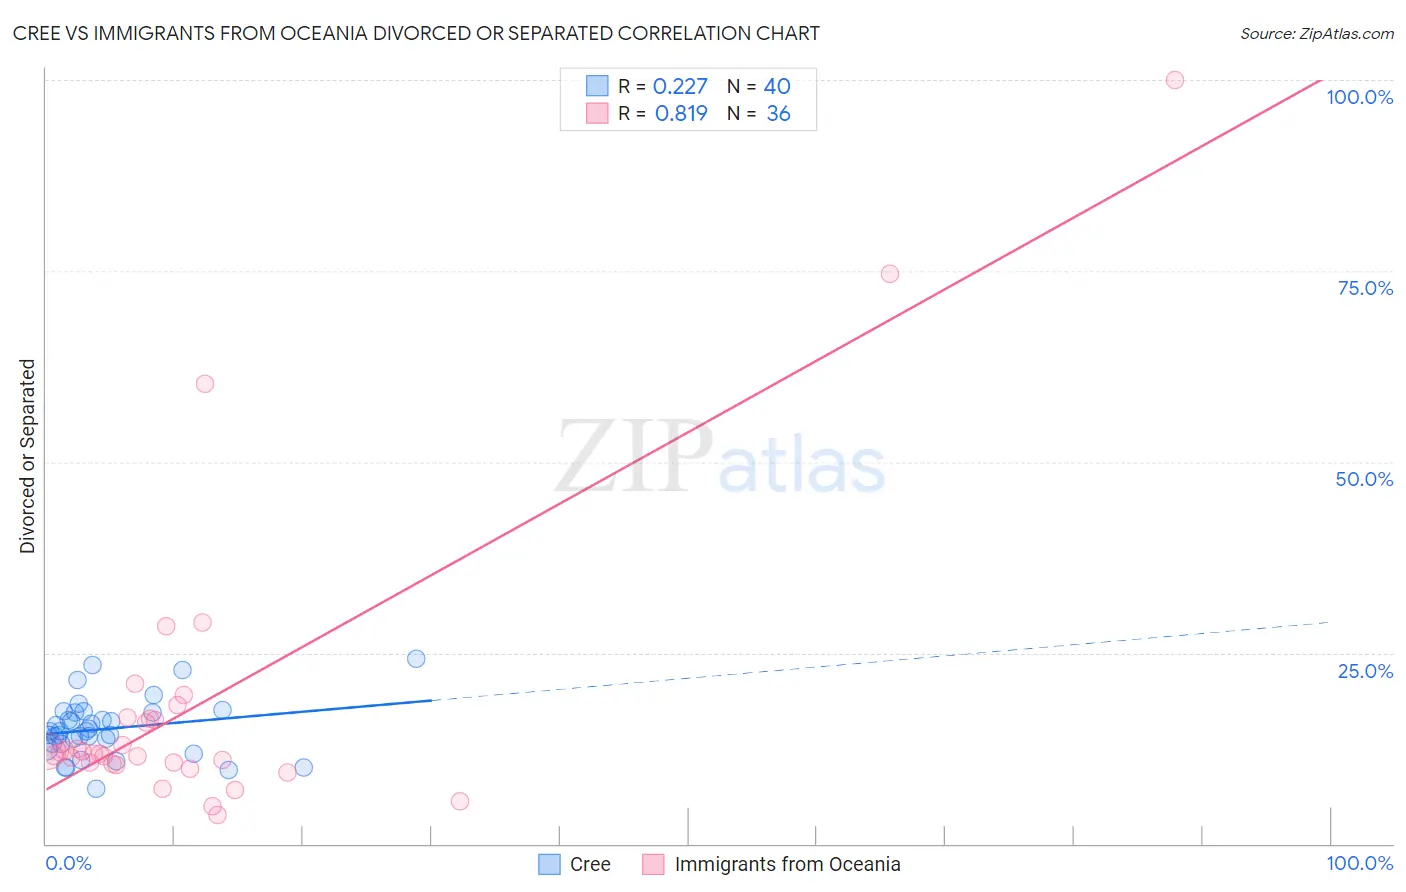
Cree vs Immigrants from Oceania Divorced or Separated Correlation Chart
The statistical analysis conducted on geographies consisting of 76,211,532 people shows a weak positive correlation between the proportion of Cree and percentage of population currently divorced or separated in the United States with a correlation coefficient (R) of 0.227 and weighted average of 13.4%. Similarly, the statistical analysis conducted on geographies consisting of 305,431,368 people shows a very strong positive correlation between the proportion of Immigrants from Oceania and percentage of population currently divorced or separated in the United States with a correlation coefficient (R) of 0.819 and weighted average of 11.9%, a difference of 12.0%.
Divorced or Separated Correlation Summary
| Measurement | Cree | Immigrants from Oceania |
| Minimum | 7.2% | 3.7% |
| Maximum | 24.3% | 100.0% |
| Range | 17.1% | 96.3% |
| Mean | 15.1% | 18.3% |
| Median | 14.7% | 11.9% |
| Interquartile 25% (IQ1) | 13.1% | 10.5% |
| Interquartile 75% (IQ3) | 17.2% | 16.5% |
| Interquartile Range (IQR) | 4.1% | 5.9% |
| Standard Deviation (Sample) | 3.8% | 19.7% |
| Standard Deviation (Population) | 3.7% | 19.4% |
Similar Demographics by Divorced or Separated
Demographics Similar to Cree by Divorced or Separated
In terms of divorced or separated, the demographic groups most similar to Cree are Haitian (13.3%, a difference of 0.030%), Puget Sound Salish (13.4%, a difference of 0.040%), Tsimshian (13.3%, a difference of 0.050%), Spanish American (13.3%, a difference of 0.080%), and Cajun (13.4%, a difference of 0.10%).
| Demographics | Rating | Rank | Divorced or Separated |
| Sioux | 0.0 /100 | #311 | Tragic 13.2% |
| Blackfeet | 0.0 /100 | #312 | Tragic 13.3% |
| Immigrants | Nicaragua | 0.0 /100 | #313 | Tragic 13.3% |
| Yaqui | 0.0 /100 | #314 | Tragic 13.3% |
| Spanish Americans | 0.0 /100 | #315 | Tragic 13.3% |
| Tsimshian | 0.0 /100 | #316 | Tragic 13.3% |
| Haitians | 0.0 /100 | #317 | Tragic 13.3% |
| Cree | 0.0 /100 | #318 | Tragic 13.4% |
| Puget Sound Salish | 0.0 /100 | #319 | Tragic 13.4% |
| Cajuns | 0.0 /100 | #320 | Tragic 13.4% |
| Cheyenne | 0.0 /100 | #321 | Tragic 13.4% |
| Immigrants | Haiti | 0.0 /100 | #322 | Tragic 13.4% |
| U.S. Virgin Islanders | 0.0 /100 | #323 | Tragic 13.4% |
| Osage | 0.0 /100 | #324 | Tragic 13.4% |
| Potawatomi | 0.0 /100 | #325 | Tragic 13.5% |
Demographics Similar to Immigrants from Oceania by Divorced or Separated
In terms of divorced or separated, the demographic groups most similar to Immigrants from Oceania are Italian (11.9%, a difference of 0.0%), Immigrants from Portugal (11.9%, a difference of 0.020%), Polish (11.9%, a difference of 0.050%), Czech (11.9%, a difference of 0.060%), and Immigrants from Grenada (11.9%, a difference of 0.070%).
| Demographics | Rating | Rank | Divorced or Separated |
| Immigrants | Zimbabwe | 81.5 /100 | #142 | Excellent 11.9% |
| Pakistanis | 81.3 /100 | #143 | Excellent 11.9% |
| Peruvians | 80.9 /100 | #144 | Excellent 11.9% |
| Croatians | 80.6 /100 | #145 | Excellent 11.9% |
| Immigrants | Grenada | 79.1 /100 | #146 | Good 11.9% |
| Poles | 78.6 /100 | #147 | Good 11.9% |
| Italians | 77.8 /100 | #148 | Good 11.9% |
| Immigrants | Oceania | 77.7 /100 | #149 | Good 11.9% |
| Immigrants | Portugal | 77.3 /100 | #150 | Good 11.9% |
| Czechs | 76.4 /100 | #151 | Good 11.9% |
| Immigrants | Hungary | 73.7 /100 | #152 | Good 11.9% |
| Austrians | 72.2 /100 | #153 | Good 12.0% |
| Chileans | 71.3 /100 | #154 | Good 12.0% |
| Japanese | 70.9 /100 | #155 | Good 12.0% |
| Hungarians | 70.3 /100 | #156 | Good 12.0% |