Immigrants from Europe vs Immigrants from Oceania Male Poverty
COMPARE
Immigrants from Europe
Immigrants from Oceania
Male Poverty
Male Poverty Comparison
Immigrants from Europe
Immigrants from Oceania
10.1%
MALE POVERTY
97.9/ 100
METRIC RATING
59th/ 347
METRIC RANK
11.2%
MALE POVERTY
50.0/ 100
METRIC RATING
174th/ 347
METRIC RANK
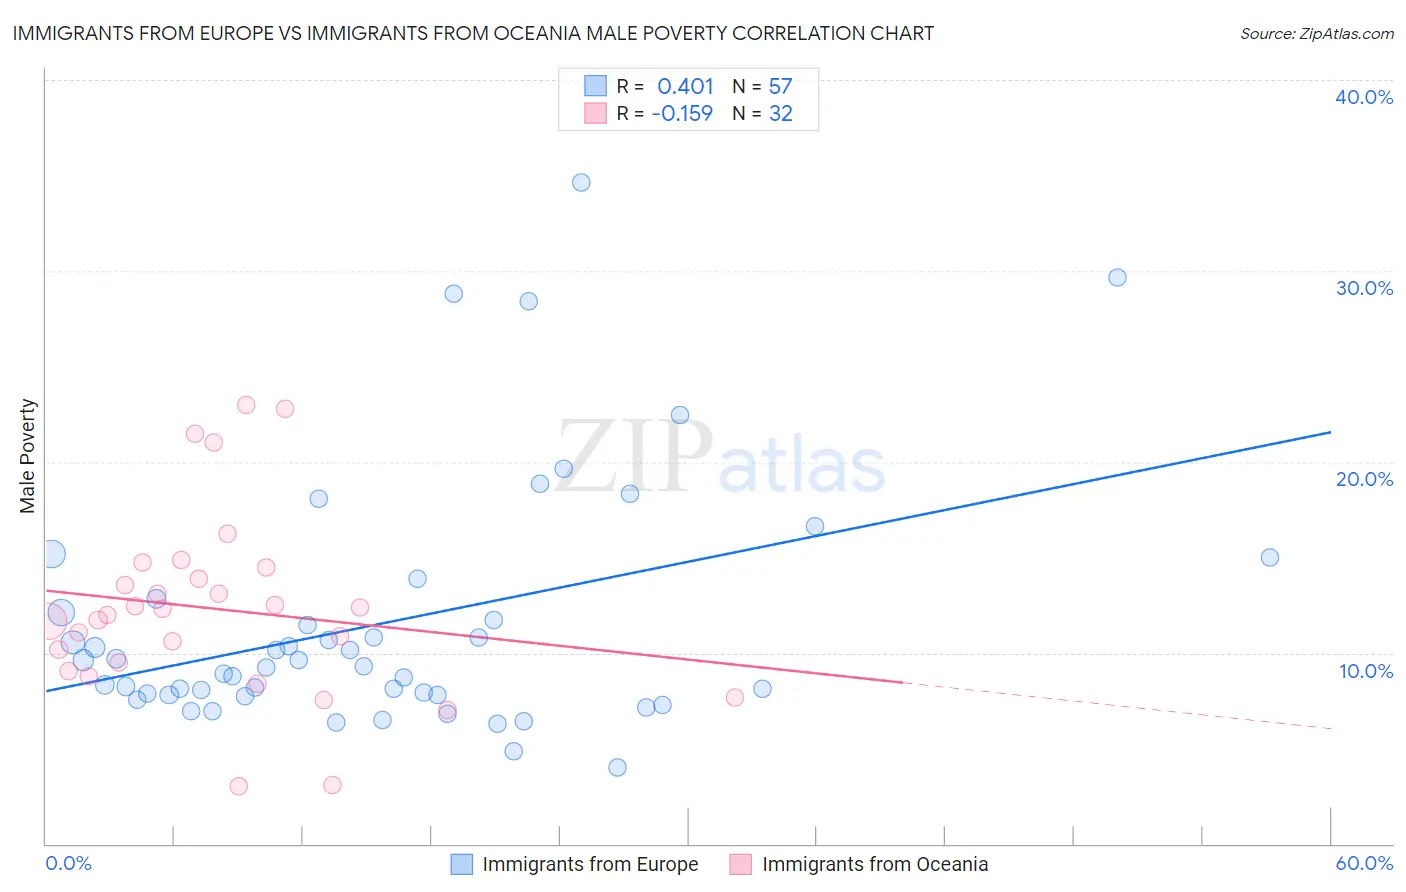
Immigrants from Europe vs Immigrants from Oceania Male Poverty Correlation Chart
The statistical analysis conducted on geographies consisting of 546,187,630 people shows a moderate positive correlation between the proportion of Immigrants from Europe and poverty level among males in the United States with a correlation coefficient (R) of 0.401 and weighted average of 10.1%. Similarly, the statistical analysis conducted on geographies consisting of 305,340,172 people shows a poor negative correlation between the proportion of Immigrants from Oceania and poverty level among males in the United States with a correlation coefficient (R) of -0.159 and weighted average of 11.2%, a difference of 10.4%.
Male Poverty Correlation Summary
| Measurement | Immigrants from Europe | Immigrants from Oceania |
| Minimum | 4.0% | 3.0% |
| Maximum | 34.6% | 23.0% |
| Range | 30.6% | 20.0% |
| Mean | 11.6% | 12.3% |
| Median | 9.3% | 12.1% |
| Interquartile 25% (IQ1) | 7.8% | 9.3% |
| Interquartile 75% (IQ3) | 12.5% | 14.2% |
| Interquartile Range (IQR) | 4.7% | 4.9% |
| Standard Deviation (Sample) | 6.5% | 4.8% |
| Standard Deviation (Population) | 6.4% | 4.8% |
Similar Demographics by Male Poverty
Demographics Similar to Immigrants from Europe by Male Poverty
In terms of male poverty, the demographic groups most similar to Immigrants from Europe are Ukrainian (10.1%, a difference of 0.090%), Austrian (10.1%, a difference of 0.11%), Scandinavian (10.1%, a difference of 0.13%), Immigrants from Italy (10.2%, a difference of 0.20%), and Estonian (10.1%, a difference of 0.21%).
| Demographics | Rating | Rank | Male Poverty |
| Asians | 98.7 /100 | #52 | Exceptional 10.0% |
| Immigrants | Czechoslovakia | 98.6 /100 | #53 | Exceptional 10.0% |
| Immigrants | Austria | 98.5 /100 | #54 | Exceptional 10.0% |
| Germans | 98.3 /100 | #55 | Exceptional 10.1% |
| Immigrants | Bulgaria | 98.2 /100 | #56 | Exceptional 10.1% |
| Estonians | 98.1 /100 | #57 | Exceptional 10.1% |
| Scandinavians | 98.0 /100 | #58 | Exceptional 10.1% |
| Immigrants | Europe | 97.9 /100 | #59 | Exceptional 10.1% |
| Ukrainians | 97.9 /100 | #60 | Exceptional 10.1% |
| Austrians | 97.8 /100 | #61 | Exceptional 10.1% |
| Immigrants | Italy | 97.8 /100 | #62 | Exceptional 10.2% |
| Slovaks | 97.7 /100 | #63 | Exceptional 10.2% |
| Swiss | 97.5 /100 | #64 | Exceptional 10.2% |
| Zimbabweans | 97.5 /100 | #65 | Exceptional 10.2% |
| Serbians | 97.5 /100 | #66 | Exceptional 10.2% |
Demographics Similar to Immigrants from Oceania by Male Poverty
In terms of male poverty, the demographic groups most similar to Immigrants from Oceania are Pennsylvania German (11.2%, a difference of 0.040%), Immigrants from Ethiopia (11.2%, a difference of 0.070%), Uruguayan (11.2%, a difference of 0.10%), Celtic (11.2%, a difference of 0.25%), and South American (11.1%, a difference of 0.37%).
| Demographics | Rating | Rank | Male Poverty |
| Hungarians | 55.1 /100 | #167 | Average 11.1% |
| Immigrants | Portugal | 54.9 /100 | #168 | Average 11.1% |
| Immigrants | Colombia | 54.2 /100 | #169 | Average 11.1% |
| South Americans | 53.8 /100 | #170 | Average 11.1% |
| Uruguayans | 51.0 /100 | #171 | Average 11.2% |
| Immigrants | Ethiopia | 50.7 /100 | #172 | Average 11.2% |
| Pennsylvania Germans | 50.5 /100 | #173 | Average 11.2% |
| Immigrants | Oceania | 50.0 /100 | #174 | Average 11.2% |
| Celtics | 47.5 /100 | #175 | Average 11.2% |
| Immigrants | Fiji | 46.0 /100 | #176 | Average 11.2% |
| Lebanese | 45.6 /100 | #177 | Average 11.2% |
| Immigrants | Cameroon | 44.5 /100 | #178 | Average 11.2% |
| Immigrants | Syria | 40.3 /100 | #179 | Average 11.3% |
| Immigrants | Morocco | 40.1 /100 | #180 | Average 11.3% |
| Immigrants | Costa Rica | 39.5 /100 | #181 | Fair 11.3% |