Costa Rican vs Somali Poverty
COMPARE
Costa Rican
Somali
Poverty
Poverty Comparison
Costa Ricans
Somalis
12.2%
POVERTY
62.2/ 100
METRIC RATING
157th/ 347
METRIC RANK
15.4%
POVERTY
0.0/ 100
METRIC RATING
302nd/ 347
METRIC RANK
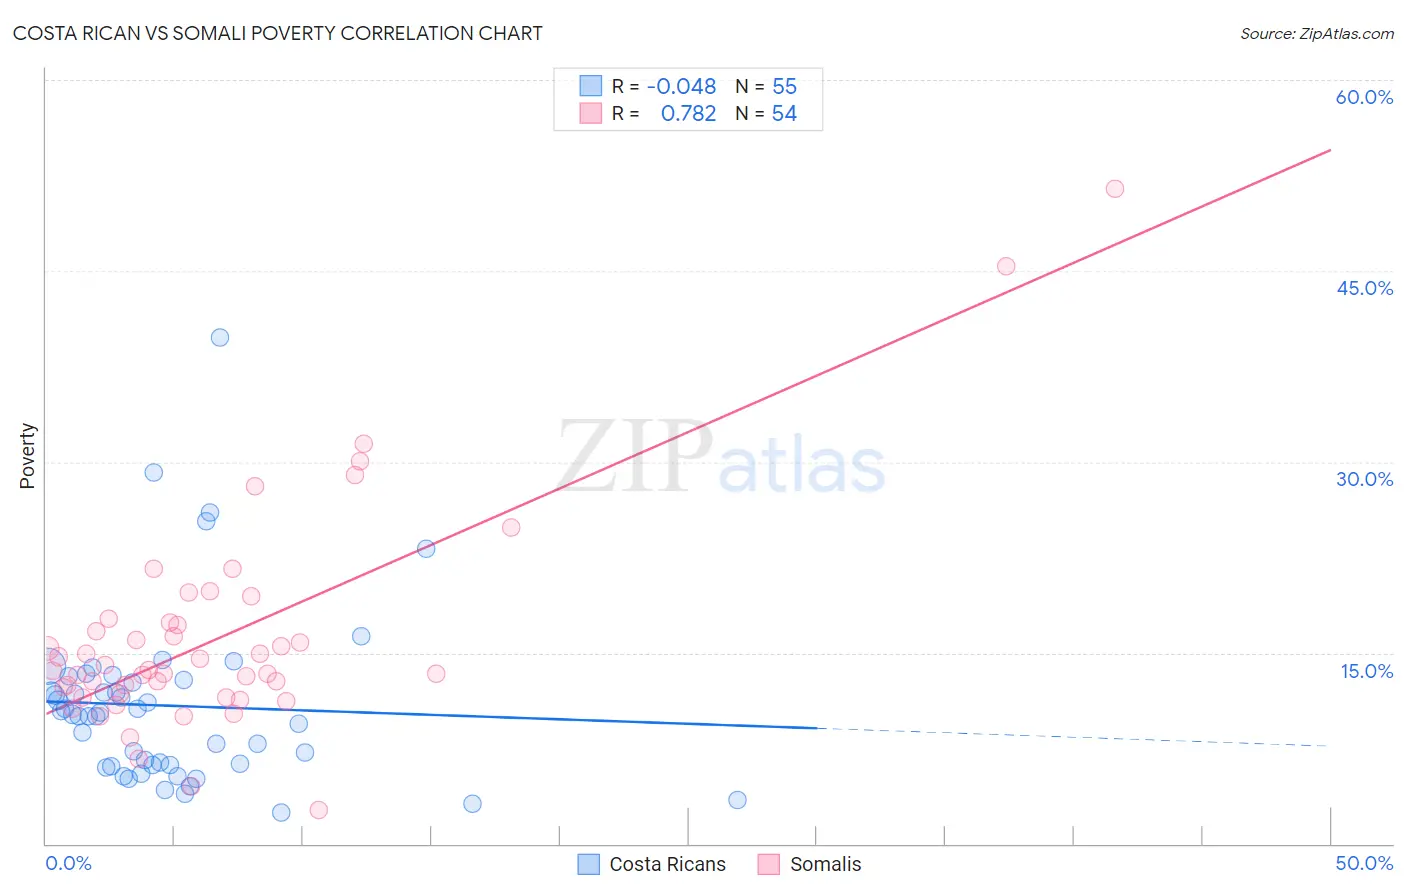
Costa Rican vs Somali Poverty Correlation Chart
The statistical analysis conducted on geographies consisting of 253,487,550 people shows no correlation between the proportion of Costa Ricans and poverty level in the United States with a correlation coefficient (R) of -0.048 and weighted average of 12.2%. Similarly, the statistical analysis conducted on geographies consisting of 99,289,063 people shows a strong positive correlation between the proportion of Somalis and poverty level in the United States with a correlation coefficient (R) of 0.782 and weighted average of 15.4%, a difference of 26.7%.
Poverty Correlation Summary
| Measurement | Costa Rican | Somali |
| Minimum | 2.4% | 2.7% |
| Maximum | 39.8% | 51.5% |
| Range | 37.4% | 48.8% |
| Mean | 10.8% | 16.2% |
| Median | 10.2% | 13.6% |
| Interquartile 25% (IQ1) | 6.2% | 11.8% |
| Interquartile 75% (IQ3) | 12.8% | 17.4% |
| Interquartile Range (IQR) | 6.6% | 5.6% |
| Standard Deviation (Sample) | 6.9% | 8.6% |
| Standard Deviation (Population) | 6.8% | 8.5% |
Similar Demographics by Poverty
Demographics Similar to Costa Ricans by Poverty
In terms of poverty, the demographic groups most similar to Costa Ricans are Scotch-Irish (12.2%, a difference of 0.040%), Taiwanese (12.2%, a difference of 0.040%), Pennsylvania German (12.2%, a difference of 0.14%), Hungarian (12.2%, a difference of 0.15%), and Immigrants from Northern Africa (12.1%, a difference of 0.18%).
| Demographics | Rating | Rank | Poverty |
| Immigrants | Kazakhstan | 72.3 /100 | #150 | Good 12.0% |
| Samoans | 71.9 /100 | #151 | Good 12.0% |
| Armenians | 67.6 /100 | #152 | Good 12.1% |
| Immigrants | Northern Africa | 63.9 /100 | #153 | Good 12.1% |
| Guamanians/Chamorros | 63.9 /100 | #154 | Good 12.1% |
| Hungarians | 63.6 /100 | #155 | Good 12.2% |
| Scotch-Irish | 62.6 /100 | #156 | Good 12.2% |
| Costa Ricans | 62.2 /100 | #157 | Good 12.2% |
| Taiwanese | 61.8 /100 | #158 | Good 12.2% |
| Pennsylvania Germans | 60.8 /100 | #159 | Good 12.2% |
| Immigrants | Nepal | 60.4 /100 | #160 | Good 12.2% |
| Immigrants | Fiji | 59.1 /100 | #161 | Average 12.2% |
| Ethiopians | 59.1 /100 | #162 | Average 12.2% |
| Immigrants | Ethiopia | 58.6 /100 | #163 | Average 12.2% |
| Colombians | 57.8 /100 | #164 | Average 12.2% |
Demographics Similar to Somalis by Poverty
In terms of poverty, the demographic groups most similar to Somalis are Bahamian (15.4%, a difference of 0.13%), Immigrants from Central America (15.4%, a difference of 0.34%), Immigrants from Caribbean (15.5%, a difference of 0.48%), Immigrants from Mexico (15.5%, a difference of 0.57%), and Immigrants from Guatemala (15.5%, a difference of 0.61%).
| Demographics | Rating | Rank | Poverty |
| Guatemalans | 0.0 /100 | #295 | Tragic 15.3% |
| Hispanics or Latinos | 0.0 /100 | #296 | Tragic 15.3% |
| Immigrants | Bangladesh | 0.0 /100 | #297 | Tragic 15.3% |
| Immigrants | Senegal | 0.0 /100 | #298 | Tragic 15.3% |
| Senegalese | 0.0 /100 | #299 | Tragic 15.3% |
| Immigrants | Central America | 0.0 /100 | #300 | Tragic 15.4% |
| Bahamians | 0.0 /100 | #301 | Tragic 15.4% |
| Somalis | 0.0 /100 | #302 | Tragic 15.4% |
| Immigrants | Caribbean | 0.0 /100 | #303 | Tragic 15.5% |
| Immigrants | Mexico | 0.0 /100 | #304 | Tragic 15.5% |
| Immigrants | Guatemala | 0.0 /100 | #305 | Tragic 15.5% |
| Creek | 0.0 /100 | #306 | Tragic 15.6% |
| Africans | 0.0 /100 | #307 | Tragic 15.6% |
| Choctaw | 0.0 /100 | #308 | Tragic 15.6% |
| Seminole | 0.0 /100 | #309 | Tragic 15.6% |