Tsimshian vs Somali Poverty
COMPARE
Tsimshian
Somali
Poverty
Poverty Comparison
Tsimshian
Somalis
13.0%
POVERTY
9.2/ 100
METRIC RATING
205th/ 347
METRIC RANK
15.4%
POVERTY
0.0/ 100
METRIC RATING
302nd/ 347
METRIC RANK
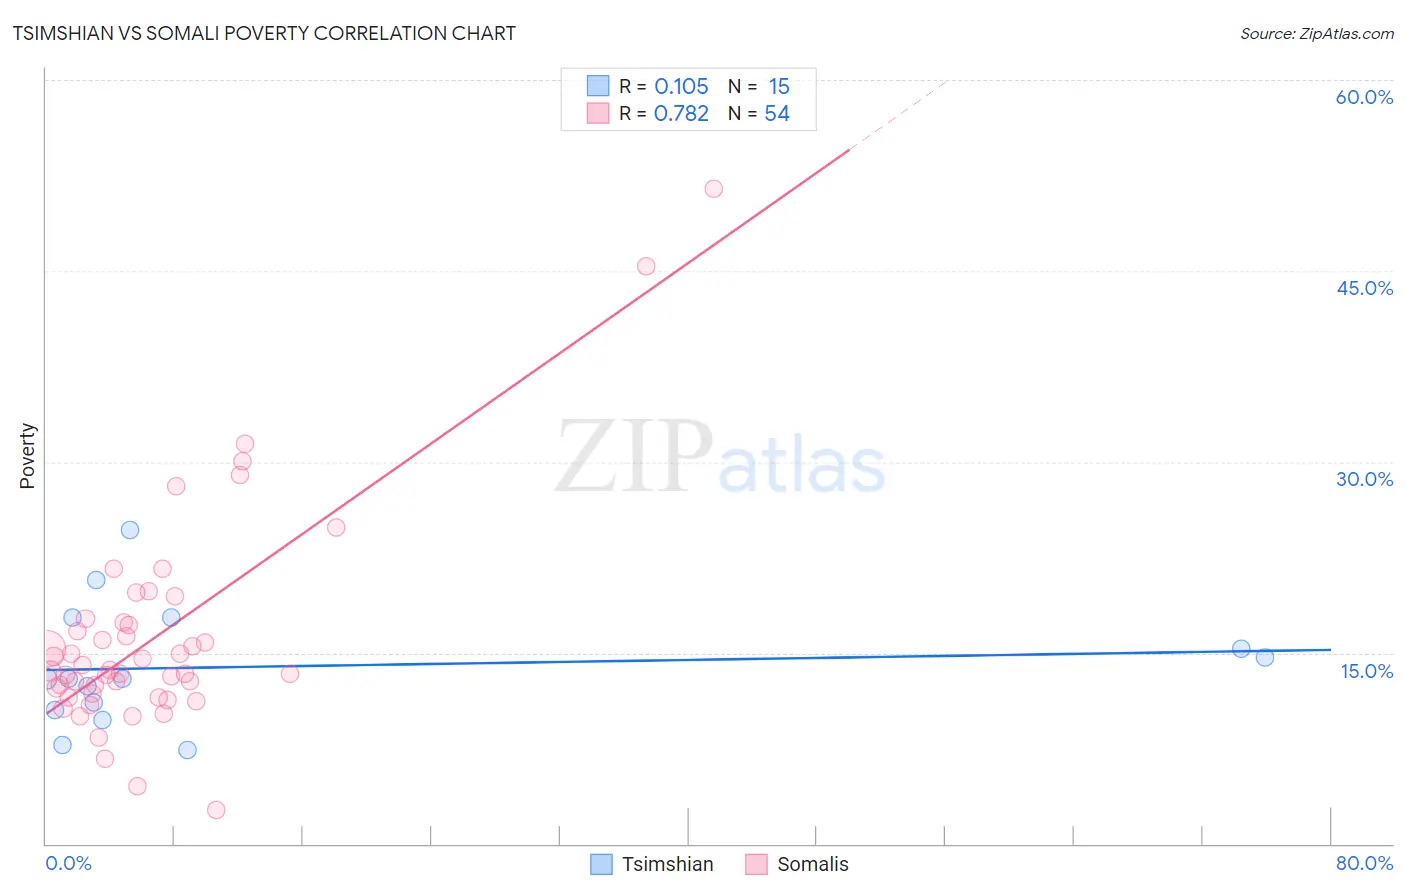
Tsimshian vs Somali Poverty Correlation Chart
The statistical analysis conducted on geographies consisting of 15,626,462 people shows a poor positive correlation between the proportion of Tsimshian and poverty level in the United States with a correlation coefficient (R) of 0.105 and weighted average of 13.0%. Similarly, the statistical analysis conducted on geographies consisting of 99,289,063 people shows a strong positive correlation between the proportion of Somalis and poverty level in the United States with a correlation coefficient (R) of 0.782 and weighted average of 15.4%, a difference of 18.5%.
Poverty Correlation Summary
| Measurement | Tsimshian | Somali |
| Minimum | 7.3% | 2.7% |
| Maximum | 24.7% | 51.5% |
| Range | 17.4% | 48.8% |
| Mean | 13.9% | 16.2% |
| Median | 12.9% | 13.6% |
| Interquartile 25% (IQ1) | 10.5% | 11.8% |
| Interquartile 75% (IQ3) | 17.7% | 17.4% |
| Interquartile Range (IQR) | 7.2% | 5.6% |
| Standard Deviation (Sample) | 4.8% | 8.6% |
| Standard Deviation (Population) | 4.6% | 8.5% |
Similar Demographics by Poverty
Demographics Similar to Tsimshian by Poverty
In terms of poverty, the demographic groups most similar to Tsimshian are Immigrants from Eastern Africa (13.1%, a difference of 0.70%), Panamanian (13.1%, a difference of 0.82%), Ugandan (13.1%, a difference of 0.98%), Malaysian (13.1%, a difference of 1.0%), and Immigrants from the Azores (13.1%, a difference of 1.0%).
| Demographics | Rating | Rank | Poverty |
| Spanish | 18.7 /100 | #198 | Poor 12.8% |
| Immigrants | Kenya | 17.5 /100 | #199 | Poor 12.8% |
| Spaniards | 16.5 /100 | #200 | Poor 12.8% |
| Immigrants | Uganda | 16.5 /100 | #201 | Poor 12.8% |
| Immigrants | Uruguay | 15.6 /100 | #202 | Poor 12.8% |
| Hmong | 15.0 /100 | #203 | Poor 12.8% |
| Immigrants | Western Asia | 14.1 /100 | #204 | Poor 12.9% |
| Tsimshian | 9.2 /100 | #205 | Tragic 13.0% |
| Immigrants | Eastern Africa | 7.0 /100 | #206 | Tragic 13.1% |
| Panamanians | 6.6 /100 | #207 | Tragic 13.1% |
| Ugandans | 6.2 /100 | #208 | Tragic 13.1% |
| Malaysians | 6.1 /100 | #209 | Tragic 13.1% |
| Immigrants | Azores | 6.1 /100 | #210 | Tragic 13.1% |
| Moroccans | 5.2 /100 | #211 | Tragic 13.2% |
| Immigrants | Immigrants | 4.3 /100 | #212 | Tragic 13.2% |
Demographics Similar to Somalis by Poverty
In terms of poverty, the demographic groups most similar to Somalis are Bahamian (15.4%, a difference of 0.13%), Immigrants from Central America (15.4%, a difference of 0.34%), Immigrants from Caribbean (15.5%, a difference of 0.48%), Immigrants from Mexico (15.5%, a difference of 0.57%), and Immigrants from Guatemala (15.5%, a difference of 0.61%).
| Demographics | Rating | Rank | Poverty |
| Guatemalans | 0.0 /100 | #295 | Tragic 15.3% |
| Hispanics or Latinos | 0.0 /100 | #296 | Tragic 15.3% |
| Immigrants | Bangladesh | 0.0 /100 | #297 | Tragic 15.3% |
| Immigrants | Senegal | 0.0 /100 | #298 | Tragic 15.3% |
| Senegalese | 0.0 /100 | #299 | Tragic 15.3% |
| Immigrants | Central America | 0.0 /100 | #300 | Tragic 15.4% |
| Bahamians | 0.0 /100 | #301 | Tragic 15.4% |
| Somalis | 0.0 /100 | #302 | Tragic 15.4% |
| Immigrants | Caribbean | 0.0 /100 | #303 | Tragic 15.5% |
| Immigrants | Mexico | 0.0 /100 | #304 | Tragic 15.5% |
| Immigrants | Guatemala | 0.0 /100 | #305 | Tragic 15.5% |
| Creek | 0.0 /100 | #306 | Tragic 15.6% |
| Africans | 0.0 /100 | #307 | Tragic 15.6% |
| Choctaw | 0.0 /100 | #308 | Tragic 15.6% |
| Seminole | 0.0 /100 | #309 | Tragic 15.6% |