British vs Somali Poverty
COMPARE
British
Somali
Poverty
Poverty Comparison
British
Somalis
11.4%
POVERTY
95.0/ 100
METRIC RATING
92nd/ 347
METRIC RANK
15.4%
POVERTY
0.0/ 100
METRIC RATING
302nd/ 347
METRIC RANK
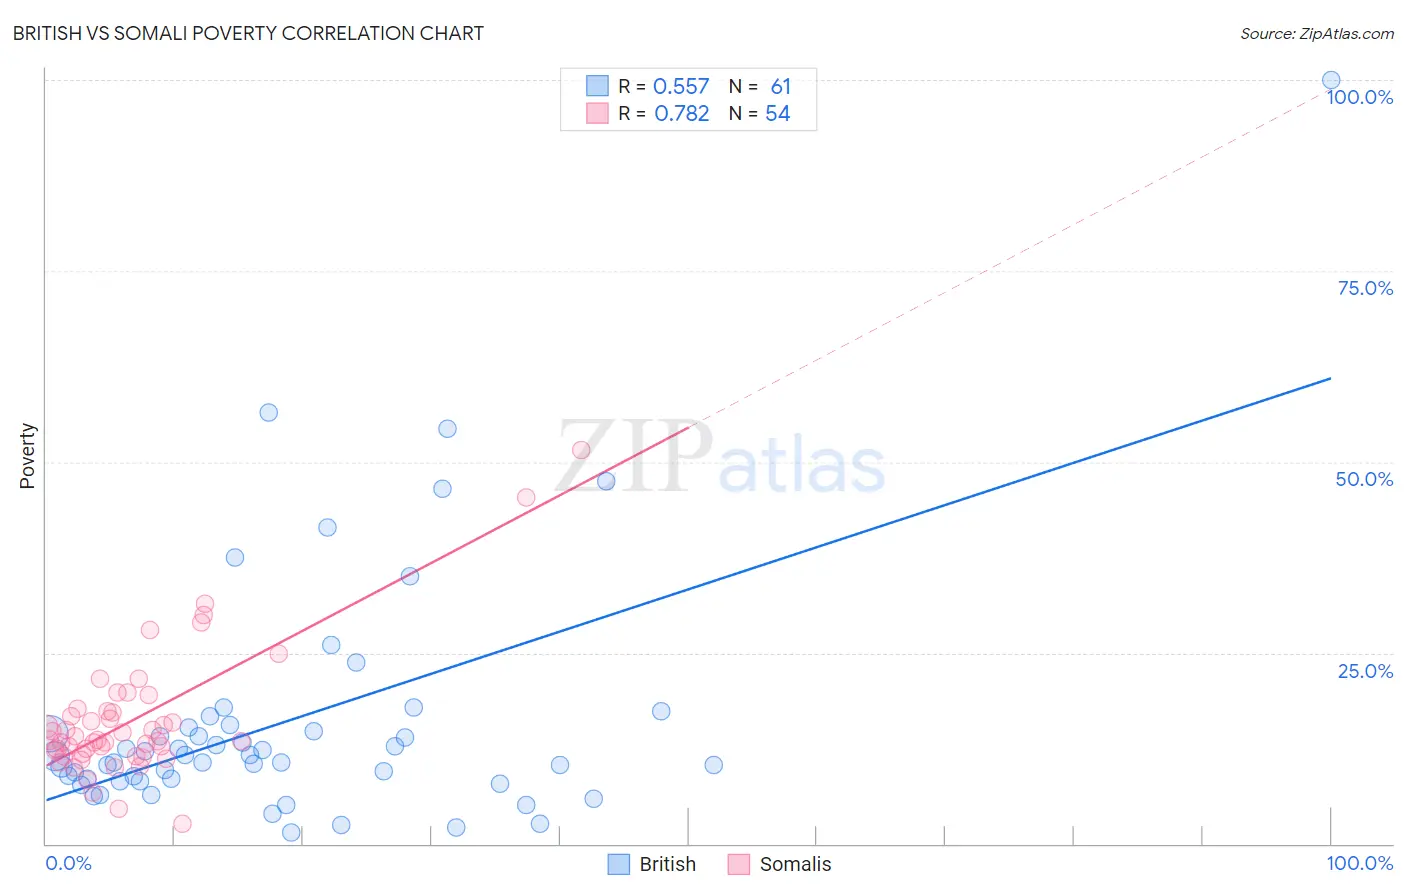
British vs Somali Poverty Correlation Chart
The statistical analysis conducted on geographies consisting of 530,938,105 people shows a substantial positive correlation between the proportion of British and poverty level in the United States with a correlation coefficient (R) of 0.557 and weighted average of 11.4%. Similarly, the statistical analysis conducted on geographies consisting of 99,289,063 people shows a strong positive correlation between the proportion of Somalis and poverty level in the United States with a correlation coefficient (R) of 0.782 and weighted average of 15.4%, a difference of 34.7%.
Poverty Correlation Summary
| Measurement | British | Somali |
| Minimum | 1.5% | 2.7% |
| Maximum | 100.0% | 51.5% |
| Range | 98.5% | 48.8% |
| Mean | 16.2% | 16.2% |
| Median | 11.4% | 13.6% |
| Interquartile 25% (IQ1) | 8.4% | 11.8% |
| Interquartile 75% (IQ3) | 15.4% | 17.4% |
| Interquartile Range (IQR) | 7.0% | 5.6% |
| Standard Deviation (Sample) | 16.5% | 8.6% |
| Standard Deviation (Population) | 16.3% | 8.5% |
Similar Demographics by Poverty
Demographics Similar to British by Poverty
In terms of poverty, the demographic groups most similar to British are Romanian (11.4%, a difference of 0.030%), Paraguayan (11.4%, a difference of 0.060%), Australian (11.4%, a difference of 0.060%), Finnish (11.4%, a difference of 0.14%), and Immigrants from South Africa (11.5%, a difference of 0.18%).
| Demographics | Rating | Rank | Poverty |
| Immigrants | England | 96.2 /100 | #85 | Exceptional 11.4% |
| Jordanians | 96.0 /100 | #86 | Exceptional 11.4% |
| Northern Europeans | 96.0 /100 | #87 | Exceptional 11.4% |
| Belgians | 95.8 /100 | #88 | Exceptional 11.4% |
| Czechoslovakians | 95.7 /100 | #89 | Exceptional 11.4% |
| Immigrants | Denmark | 95.5 /100 | #90 | Exceptional 11.4% |
| Finns | 95.2 /100 | #91 | Exceptional 11.4% |
| British | 95.0 /100 | #92 | Exceptional 11.4% |
| Romanians | 94.9 /100 | #93 | Exceptional 11.4% |
| Paraguayans | 94.9 /100 | #94 | Exceptional 11.4% |
| Australians | 94.9 /100 | #95 | Exceptional 11.4% |
| Immigrants | South Africa | 94.7 /100 | #96 | Exceptional 11.5% |
| Immigrants | Egypt | 94.6 /100 | #97 | Exceptional 11.5% |
| Immigrants | Latvia | 94.5 /100 | #98 | Exceptional 11.5% |
| Immigrants | Indonesia | 94.2 /100 | #99 | Exceptional 11.5% |
Demographics Similar to Somalis by Poverty
In terms of poverty, the demographic groups most similar to Somalis are Bahamian (15.4%, a difference of 0.13%), Immigrants from Central America (15.4%, a difference of 0.34%), Immigrants from Caribbean (15.5%, a difference of 0.48%), Immigrants from Mexico (15.5%, a difference of 0.57%), and Immigrants from Guatemala (15.5%, a difference of 0.61%).
| Demographics | Rating | Rank | Poverty |
| Guatemalans | 0.0 /100 | #295 | Tragic 15.3% |
| Hispanics or Latinos | 0.0 /100 | #296 | Tragic 15.3% |
| Immigrants | Bangladesh | 0.0 /100 | #297 | Tragic 15.3% |
| Immigrants | Senegal | 0.0 /100 | #298 | Tragic 15.3% |
| Senegalese | 0.0 /100 | #299 | Tragic 15.3% |
| Immigrants | Central America | 0.0 /100 | #300 | Tragic 15.4% |
| Bahamians | 0.0 /100 | #301 | Tragic 15.4% |
| Somalis | 0.0 /100 | #302 | Tragic 15.4% |
| Immigrants | Caribbean | 0.0 /100 | #303 | Tragic 15.5% |
| Immigrants | Mexico | 0.0 /100 | #304 | Tragic 15.5% |
| Immigrants | Guatemala | 0.0 /100 | #305 | Tragic 15.5% |
| Creek | 0.0 /100 | #306 | Tragic 15.6% |
| Africans | 0.0 /100 | #307 | Tragic 15.6% |
| Choctaw | 0.0 /100 | #308 | Tragic 15.6% |
| Seminole | 0.0 /100 | #309 | Tragic 15.6% |