Costa Rican vs Immigrants from Italy Poverty
COMPARE
Costa Rican
Immigrants from Italy
Poverty
Poverty Comparison
Costa Ricans
Immigrants from Italy
12.2%
POVERTY
62.2/ 100
METRIC RATING
157th/ 347
METRIC RANK
11.2%
POVERTY
97.9/ 100
METRIC RATING
61st/ 347
METRIC RANK
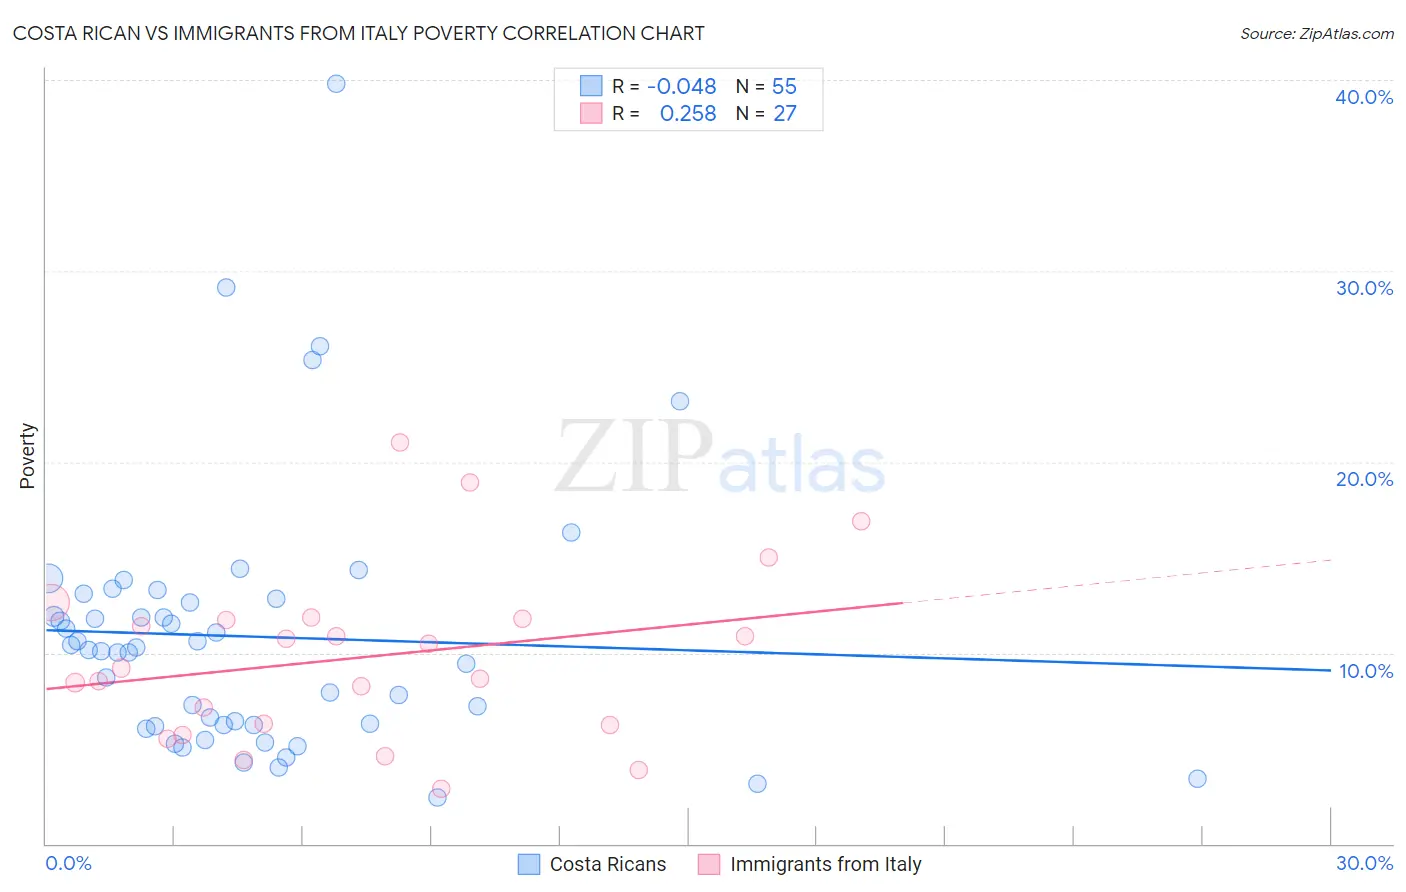
Costa Rican vs Immigrants from Italy Poverty Correlation Chart
The statistical analysis conducted on geographies consisting of 253,487,550 people shows no correlation between the proportion of Costa Ricans and poverty level in the United States with a correlation coefficient (R) of -0.048 and weighted average of 12.2%. Similarly, the statistical analysis conducted on geographies consisting of 324,121,527 people shows a weak positive correlation between the proportion of Immigrants from Italy and poverty level in the United States with a correlation coefficient (R) of 0.258 and weighted average of 11.2%, a difference of 8.9%.
Poverty Correlation Summary
| Measurement | Costa Rican | Immigrants from Italy |
| Minimum | 2.4% | 2.9% |
| Maximum | 39.8% | 21.0% |
| Range | 37.4% | 18.1% |
| Mean | 10.8% | 9.8% |
| Median | 10.2% | 9.2% |
| Interquartile 25% (IQ1) | 6.2% | 6.2% |
| Interquartile 75% (IQ3) | 12.8% | 11.8% |
| Interquartile Range (IQR) | 6.6% | 5.5% |
| Standard Deviation (Sample) | 6.9% | 4.5% |
| Standard Deviation (Population) | 6.8% | 4.4% |
Similar Demographics by Poverty
Demographics Similar to Costa Ricans by Poverty
In terms of poverty, the demographic groups most similar to Costa Ricans are Scotch-Irish (12.2%, a difference of 0.040%), Taiwanese (12.2%, a difference of 0.040%), Pennsylvania German (12.2%, a difference of 0.14%), Hungarian (12.2%, a difference of 0.15%), and Immigrants from Northern Africa (12.1%, a difference of 0.18%).
| Demographics | Rating | Rank | Poverty |
| Immigrants | Kazakhstan | 72.3 /100 | #150 | Good 12.0% |
| Samoans | 71.9 /100 | #151 | Good 12.0% |
| Armenians | 67.6 /100 | #152 | Good 12.1% |
| Immigrants | Northern Africa | 63.9 /100 | #153 | Good 12.1% |
| Guamanians/Chamorros | 63.9 /100 | #154 | Good 12.1% |
| Hungarians | 63.6 /100 | #155 | Good 12.2% |
| Scotch-Irish | 62.6 /100 | #156 | Good 12.2% |
| Costa Ricans | 62.2 /100 | #157 | Good 12.2% |
| Taiwanese | 61.8 /100 | #158 | Good 12.2% |
| Pennsylvania Germans | 60.8 /100 | #159 | Good 12.2% |
| Immigrants | Nepal | 60.4 /100 | #160 | Good 12.2% |
| Immigrants | Fiji | 59.1 /100 | #161 | Average 12.2% |
| Ethiopians | 59.1 /100 | #162 | Average 12.2% |
| Immigrants | Ethiopia | 58.6 /100 | #163 | Average 12.2% |
| Colombians | 57.8 /100 | #164 | Average 12.2% |
Demographics Similar to Immigrants from Italy by Poverty
In terms of poverty, the demographic groups most similar to Immigrants from Italy are Austrian (11.2%, a difference of 0.030%), Ukrainian (11.2%, a difference of 0.040%), Immigrants from Sri Lanka (11.2%, a difference of 0.060%), Immigrants from Europe (11.2%, a difference of 0.22%), and Swiss (11.2%, a difference of 0.25%).
| Demographics | Rating | Rank | Poverty |
| Immigrants | Bulgaria | 98.5 /100 | #54 | Exceptional 11.1% |
| Immigrants | Serbia | 98.5 /100 | #55 | Exceptional 11.1% |
| Estonians | 98.2 /100 | #56 | Exceptional 11.1% |
| Scandinavians | 98.2 /100 | #57 | Exceptional 11.1% |
| Germans | 98.1 /100 | #58 | Exceptional 11.1% |
| Immigrants | Europe | 98.0 /100 | #59 | Exceptional 11.2% |
| Immigrants | Sri Lanka | 97.9 /100 | #60 | Exceptional 11.2% |
| Immigrants | Italy | 97.9 /100 | #61 | Exceptional 11.2% |
| Austrians | 97.8 /100 | #62 | Exceptional 11.2% |
| Ukrainians | 97.8 /100 | #63 | Exceptional 11.2% |
| Swiss | 97.7 /100 | #64 | Exceptional 11.2% |
| Immigrants | Asia | 97.5 /100 | #65 | Exceptional 11.2% |
| Immigrants | Netherlands | 97.5 /100 | #66 | Exceptional 11.2% |
| Immigrants | Australia | 97.4 /100 | #67 | Exceptional 11.2% |
| Slovaks | 97.4 /100 | #68 | Exceptional 11.2% |