Costa Rican vs Marshallese Poverty
COMPARE
Costa Rican
Marshallese
Poverty
Poverty Comparison
Costa Ricans
Marshallese
12.2%
POVERTY
62.2/ 100
METRIC RATING
157th/ 347
METRIC RANK
13.4%
POVERTY
2.2/ 100
METRIC RATING
226th/ 347
METRIC RANK
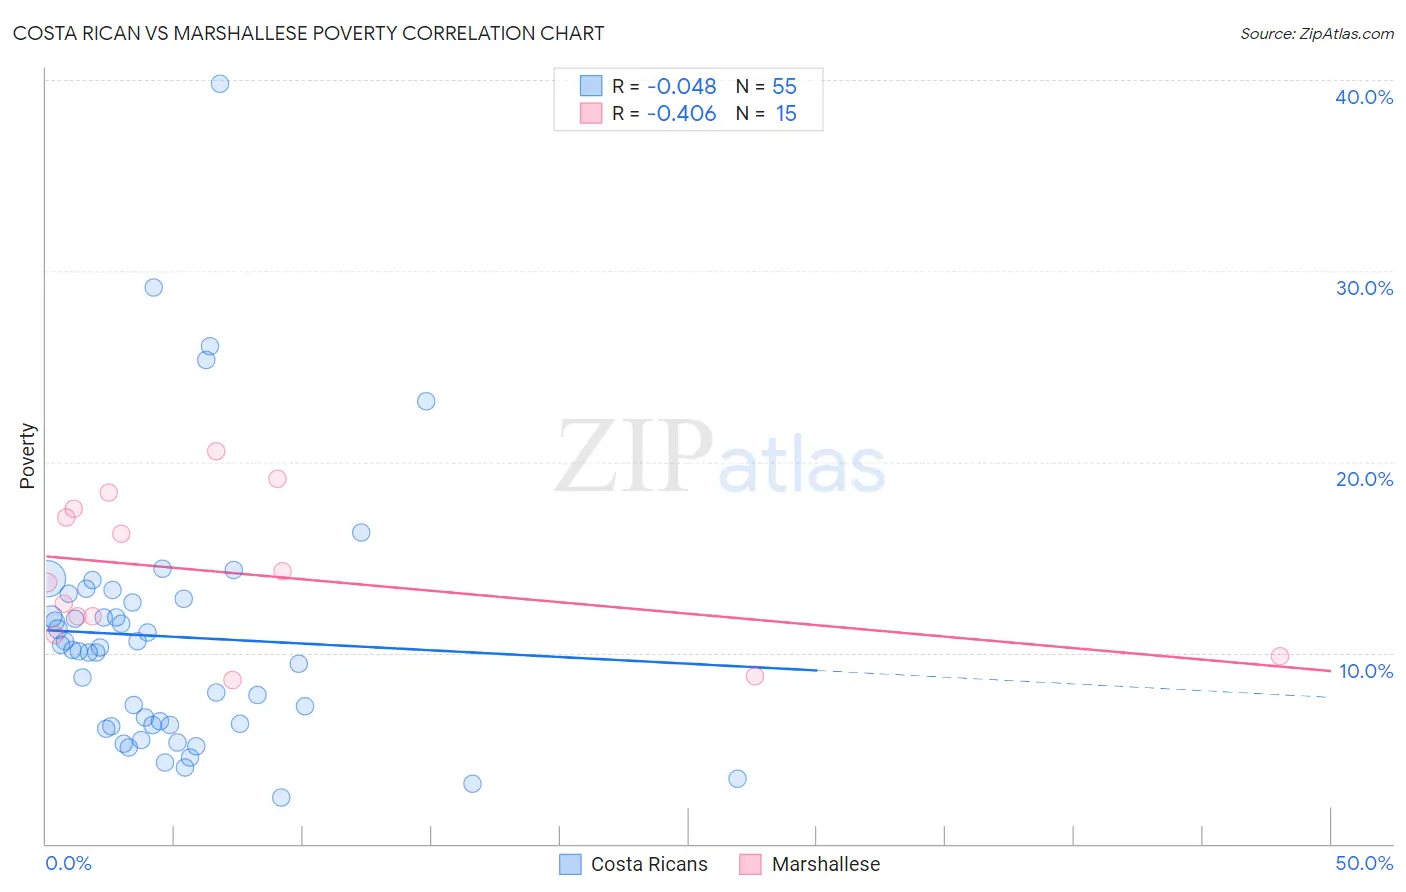
Costa Rican vs Marshallese Poverty Correlation Chart
The statistical analysis conducted on geographies consisting of 253,487,550 people shows no correlation between the proportion of Costa Ricans and poverty level in the United States with a correlation coefficient (R) of -0.048 and weighted average of 12.2%. Similarly, the statistical analysis conducted on geographies consisting of 14,760,991 people shows a moderate negative correlation between the proportion of Marshallese and poverty level in the United States with a correlation coefficient (R) of -0.406 and weighted average of 13.4%, a difference of 10.5%.
Poverty Correlation Summary
| Measurement | Costa Rican | Marshallese |
| Minimum | 2.4% | 8.6% |
| Maximum | 39.8% | 20.5% |
| Range | 37.4% | 12.0% |
| Mean | 10.8% | 14.1% |
| Median | 10.2% | 13.7% |
| Interquartile 25% (IQ1) | 6.2% | 10.9% |
| Interquartile 75% (IQ3) | 12.8% | 17.5% |
| Interquartile Range (IQR) | 6.6% | 6.6% |
| Standard Deviation (Sample) | 6.9% | 3.9% |
| Standard Deviation (Population) | 6.8% | 3.7% |
Similar Demographics by Poverty
Demographics Similar to Costa Ricans by Poverty
In terms of poverty, the demographic groups most similar to Costa Ricans are Scotch-Irish (12.2%, a difference of 0.040%), Taiwanese (12.2%, a difference of 0.040%), Pennsylvania German (12.2%, a difference of 0.14%), Hungarian (12.2%, a difference of 0.15%), and Immigrants from Northern Africa (12.1%, a difference of 0.18%).
| Demographics | Rating | Rank | Poverty |
| Immigrants | Kazakhstan | 72.3 /100 | #150 | Good 12.0% |
| Samoans | 71.9 /100 | #151 | Good 12.0% |
| Armenians | 67.6 /100 | #152 | Good 12.1% |
| Immigrants | Northern Africa | 63.9 /100 | #153 | Good 12.1% |
| Guamanians/Chamorros | 63.9 /100 | #154 | Good 12.1% |
| Hungarians | 63.6 /100 | #155 | Good 12.2% |
| Scotch-Irish | 62.6 /100 | #156 | Good 12.2% |
| Costa Ricans | 62.2 /100 | #157 | Good 12.2% |
| Taiwanese | 61.8 /100 | #158 | Good 12.2% |
| Pennsylvania Germans | 60.8 /100 | #159 | Good 12.2% |
| Immigrants | Nepal | 60.4 /100 | #160 | Good 12.2% |
| Immigrants | Fiji | 59.1 /100 | #161 | Average 12.2% |
| Ethiopians | 59.1 /100 | #162 | Average 12.2% |
| Immigrants | Ethiopia | 58.6 /100 | #163 | Average 12.2% |
| Colombians | 57.8 /100 | #164 | Average 12.2% |
Demographics Similar to Marshallese by Poverty
In terms of poverty, the demographic groups most similar to Marshallese are German Russian (13.4%, a difference of 0.010%), Alaska Native (13.5%, a difference of 0.15%), Immigrants from Eritrea (13.4%, a difference of 0.23%), Immigrants from Africa (13.4%, a difference of 0.33%), and Immigrants from Micronesia (13.4%, a difference of 0.36%).
| Demographics | Rating | Rank | Poverty |
| Immigrants | Cambodia | 3.0 /100 | #219 | Tragic 13.4% |
| Americans | 2.9 /100 | #220 | Tragic 13.4% |
| Alsatians | 2.6 /100 | #221 | Tragic 13.4% |
| Immigrants | Micronesia | 2.6 /100 | #222 | Tragic 13.4% |
| Immigrants | Africa | 2.5 /100 | #223 | Tragic 13.4% |
| Immigrants | Eritrea | 2.4 /100 | #224 | Tragic 13.4% |
| German Russians | 2.2 /100 | #225 | Tragic 13.4% |
| Marshallese | 2.2 /100 | #226 | Tragic 13.4% |
| Alaska Natives | 2.1 /100 | #227 | Tragic 13.5% |
| Immigrants | Nigeria | 1.7 /100 | #228 | Tragic 13.5% |
| Osage | 1.5 /100 | #229 | Tragic 13.6% |
| Alaskan Athabascans | 1.5 /100 | #230 | Tragic 13.6% |
| Nigerians | 1.4 /100 | #231 | Tragic 13.6% |
| Fijians | 0.8 /100 | #232 | Tragic 13.7% |
| Immigrants | Saudi Arabia | 0.8 /100 | #233 | Tragic 13.8% |